
CARTopiaX: Extending a Next-Generation Platform for Computational Cancer Biology; Results
Introduction
This is my second Google Summer of Code with the Compiler Research Team. During GSoC 2025 I created CARTopiaX from scratch, and this year I have extended it to replicate a new state-of-the-art wet-lab experiment, demonstrating that it can be adapted to study new biological scenarios.
Project Overview
CAR T-cell therapy is a form of cancer immunotherapy that engineers a patient’s T cells to recognize and destroy malignant cells. While it is highly effective in hematological cancers such as leukemia, and is supported by numerous mathematical models, it still struggles in solid tumors, where robust simulation models remain scarce despite their importance for optimizing treatment strategies.
CARTopiaX is an agent-based model (ABM) built on BioDynaMo, a high-performance, open-source platform for large-scale biological modeling. It implements the mathematical framework described in the Nature Scientific Reports publication “In silico study of heterogeneous tumour-derived organoid response to CAR T-cell therapy” (2024), and provides a platform for simulating tumor–immune interactions, testing hypotheses, and evaluating CAR T-cell treatment strategies in silico.
Goal of this year's project: extend and calibrate CARTopiaX to reproduce a state-of-the-art CAR T-cell experiment, demonstrating it as a flexible and robust framework for in silico hypothesis testing that accelerates research and reduces reliance on costly wet-lab experiments.
The Selected Paper: Evaluating CAR-T Cell Therapy in a Hypoxic 3D Tumor Model
The replicated study is Ando et al., “Evaluating CAR-T Cell Therapy in a Hypoxic 3D Tumor Model”, Advanced Healthcare Materials (2019):
- Experimental setup: HER2+ SKOV3 ovarian cancer cells are embedded in a cylindrical 3D GelMA hydrogel with a radius of 3000 µm. A polycarbonate cap placed on top of the tumor acts as a diffusion barrier, so oxygen can only enter from the edges, creating a hypoxic environment. This is compared against normoxia (no cap).
- Treatment protocol: anti-HER2 CAR T-cells are delivered through the channel surrounding the tumor at a 20:1 effector-to-target (E:T) ratio, over a total experimental duration of 72 hours.
- Limited T-cell infiltration: despite high tumor mortality, CAR T-cell infiltration into the hydrogel was negligible, with most immune cells remaining at the edges.
- Bystander killing: cancer cells died far from the CAR T-cells, in the core of the tumor. The authors called this “non-contact mediated” CAR T-cell cytotoxicity and hypothesized that it is driven by metabolic competition: activated CAR T-cells at the periphery consume nutrients, starving the already stressed cancer cells in the center.
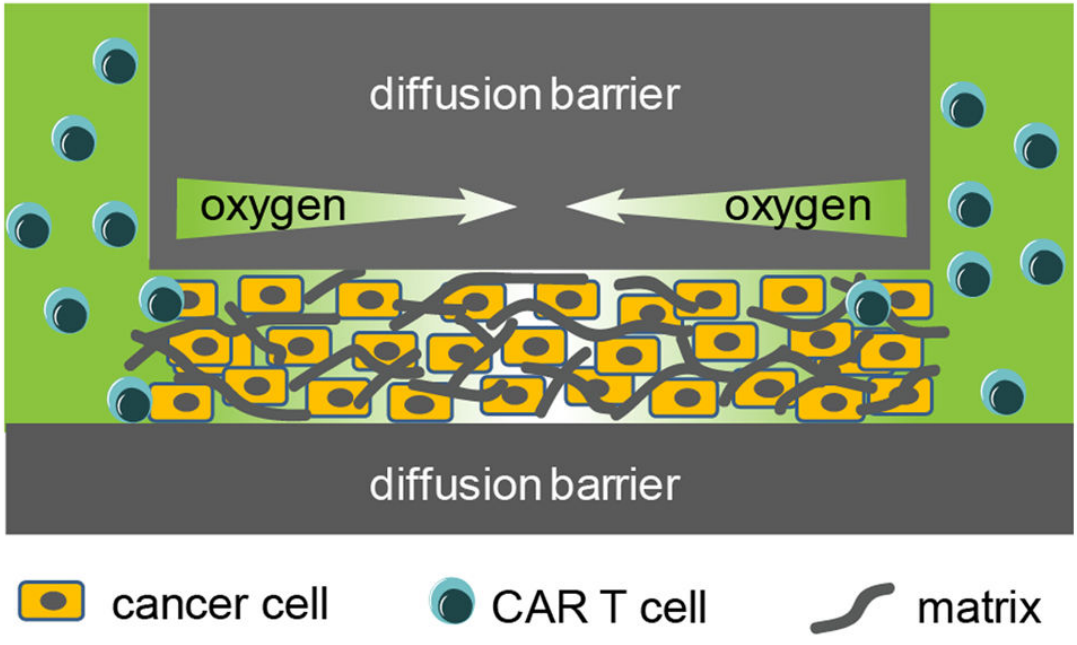
Experimental setup. Image from Ando et al. (2019).
The New Model: a Cylindrical Tumor Mass
To replicate this experiment, CARTopiaX was extended with a completely new scenario:
- New tumor geometry: a cylindrical tumor mass, where oxygen enters only from the border of the cylinder when the cap is present.
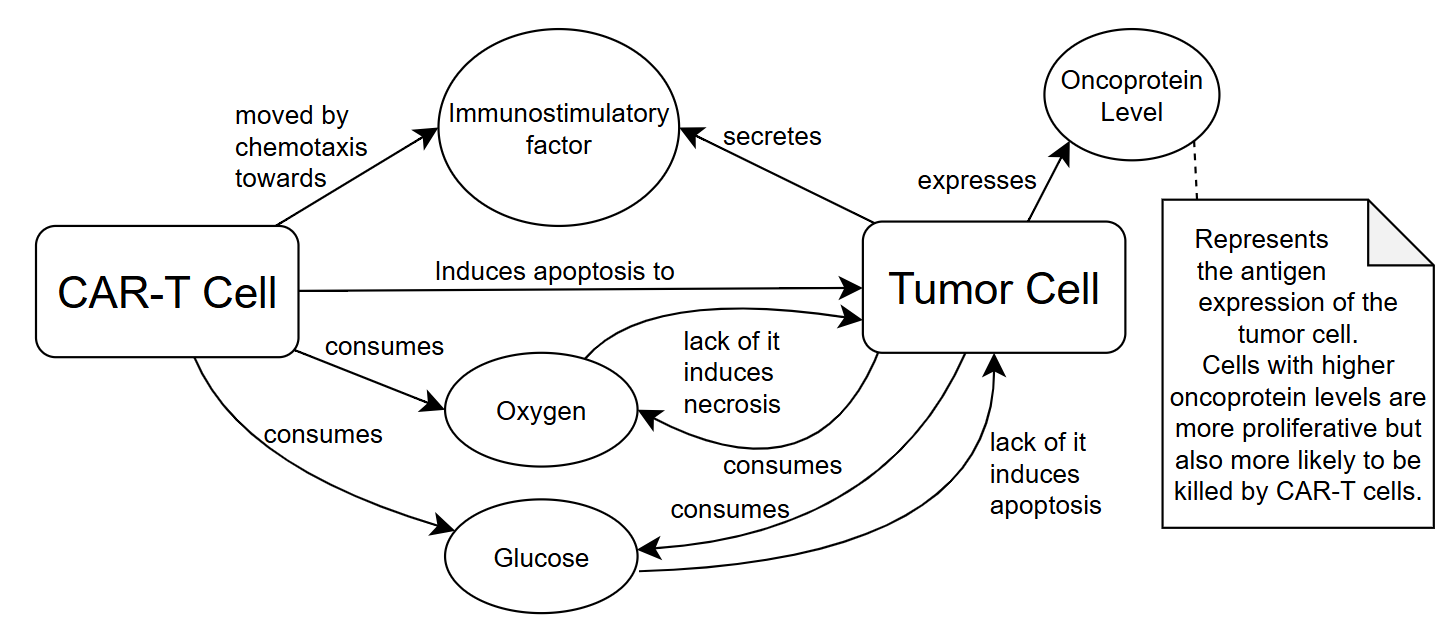
- Glucose as a new diffusing substance: both tumor cells and CAR T-cells consume it. Its lack limits cell proliferation and can even starve cells to death (apoptosis).
- New cell behaviors and mechanics: CAR T-cells now also consume oxygen and glucose, competing metabolically with cancer cells, while still moving by chemotaxis towards the immunostimulatory factor secreted by tumor cells and inducing apoptosis in them.
- New outputs: radial profiles of all the simulation metrics, and tracking of the cause of death of each tumor cell (lack of oxygen, lack of glucose, CAR T-cell killing, or random natural causes).
Data Extraction and Processing
The experimental data reported in the paper are radial profiles of dead tumor cells: the tumor is divided into concentric rings, and the number of dead cells in each ring is counted. To compare these data with CARTopiaX:
- The data points were extracted from the figures of the paper and smoothed with a spline fit.
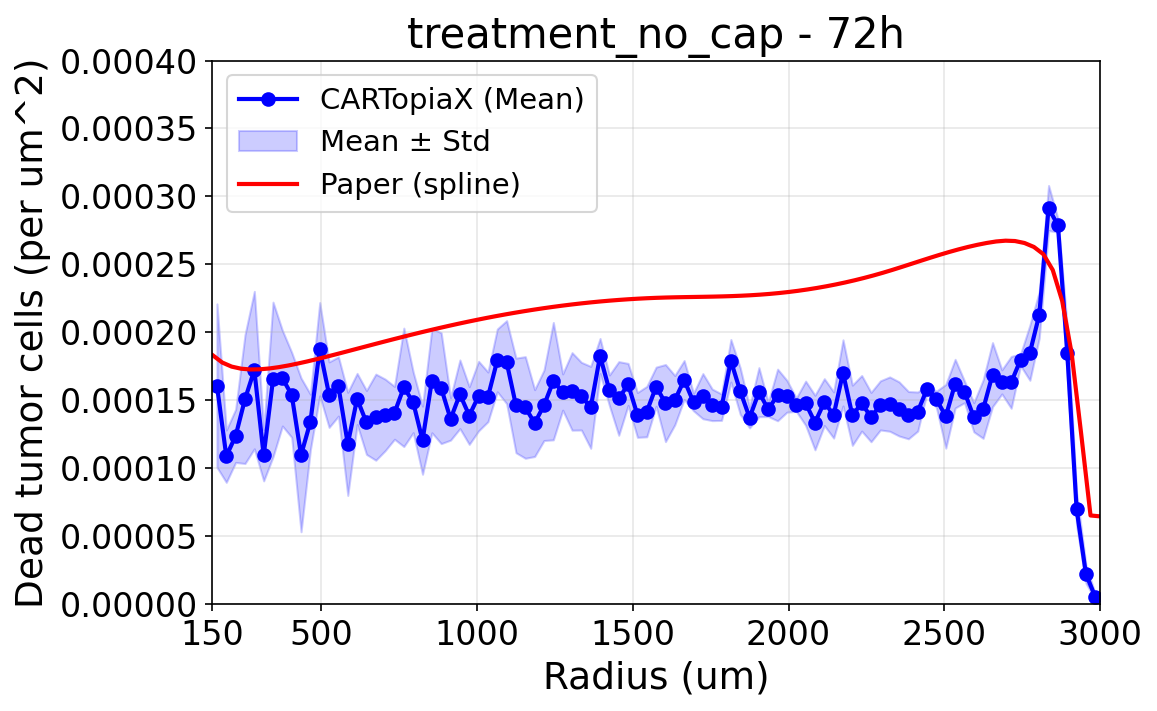
- Since the area of each ring grows with the radius, outer rings naturally contain more cells than inner ones. To study the trends independently of this effect, the absolute numbers were normalized by the area of each ring, obtaining a density of dead cells per µm².
Points at radii below 150 µm are omitted in the density plots: the innermost rings are so small that they contain very few cells, which results in large variations and a dividing area that tends to zero.
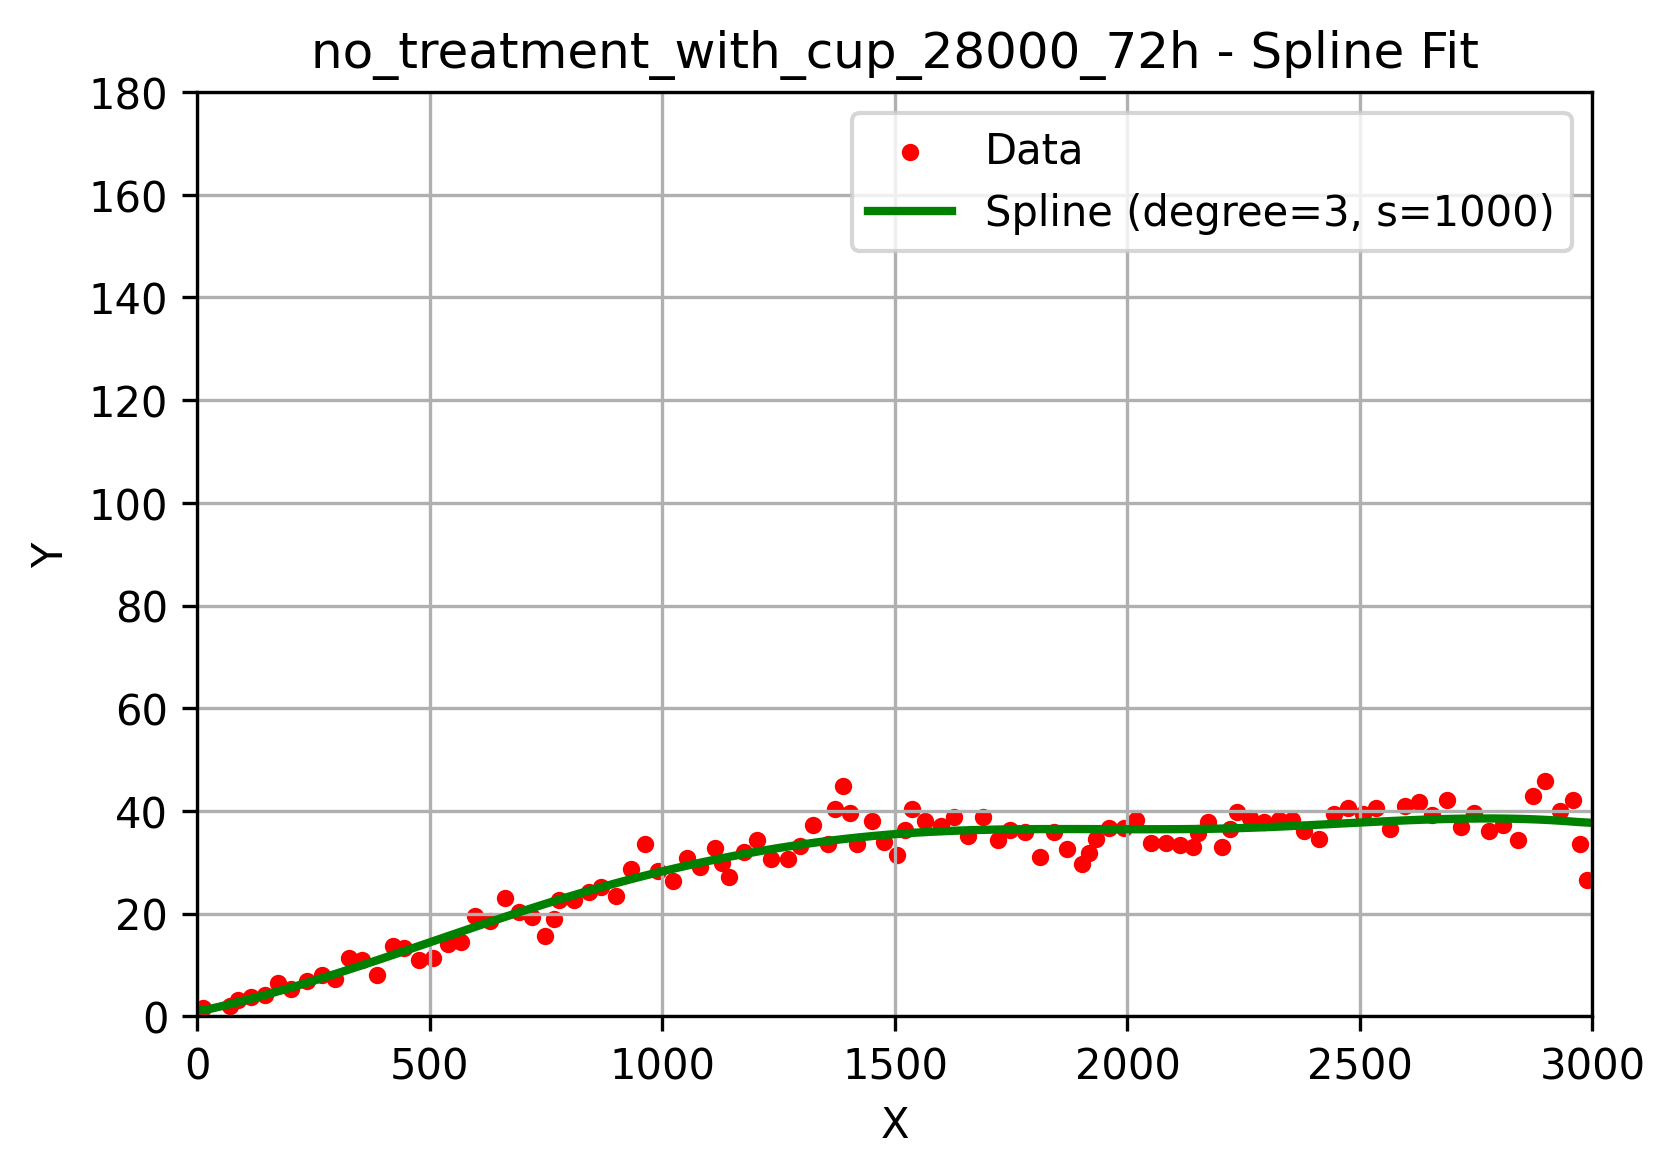
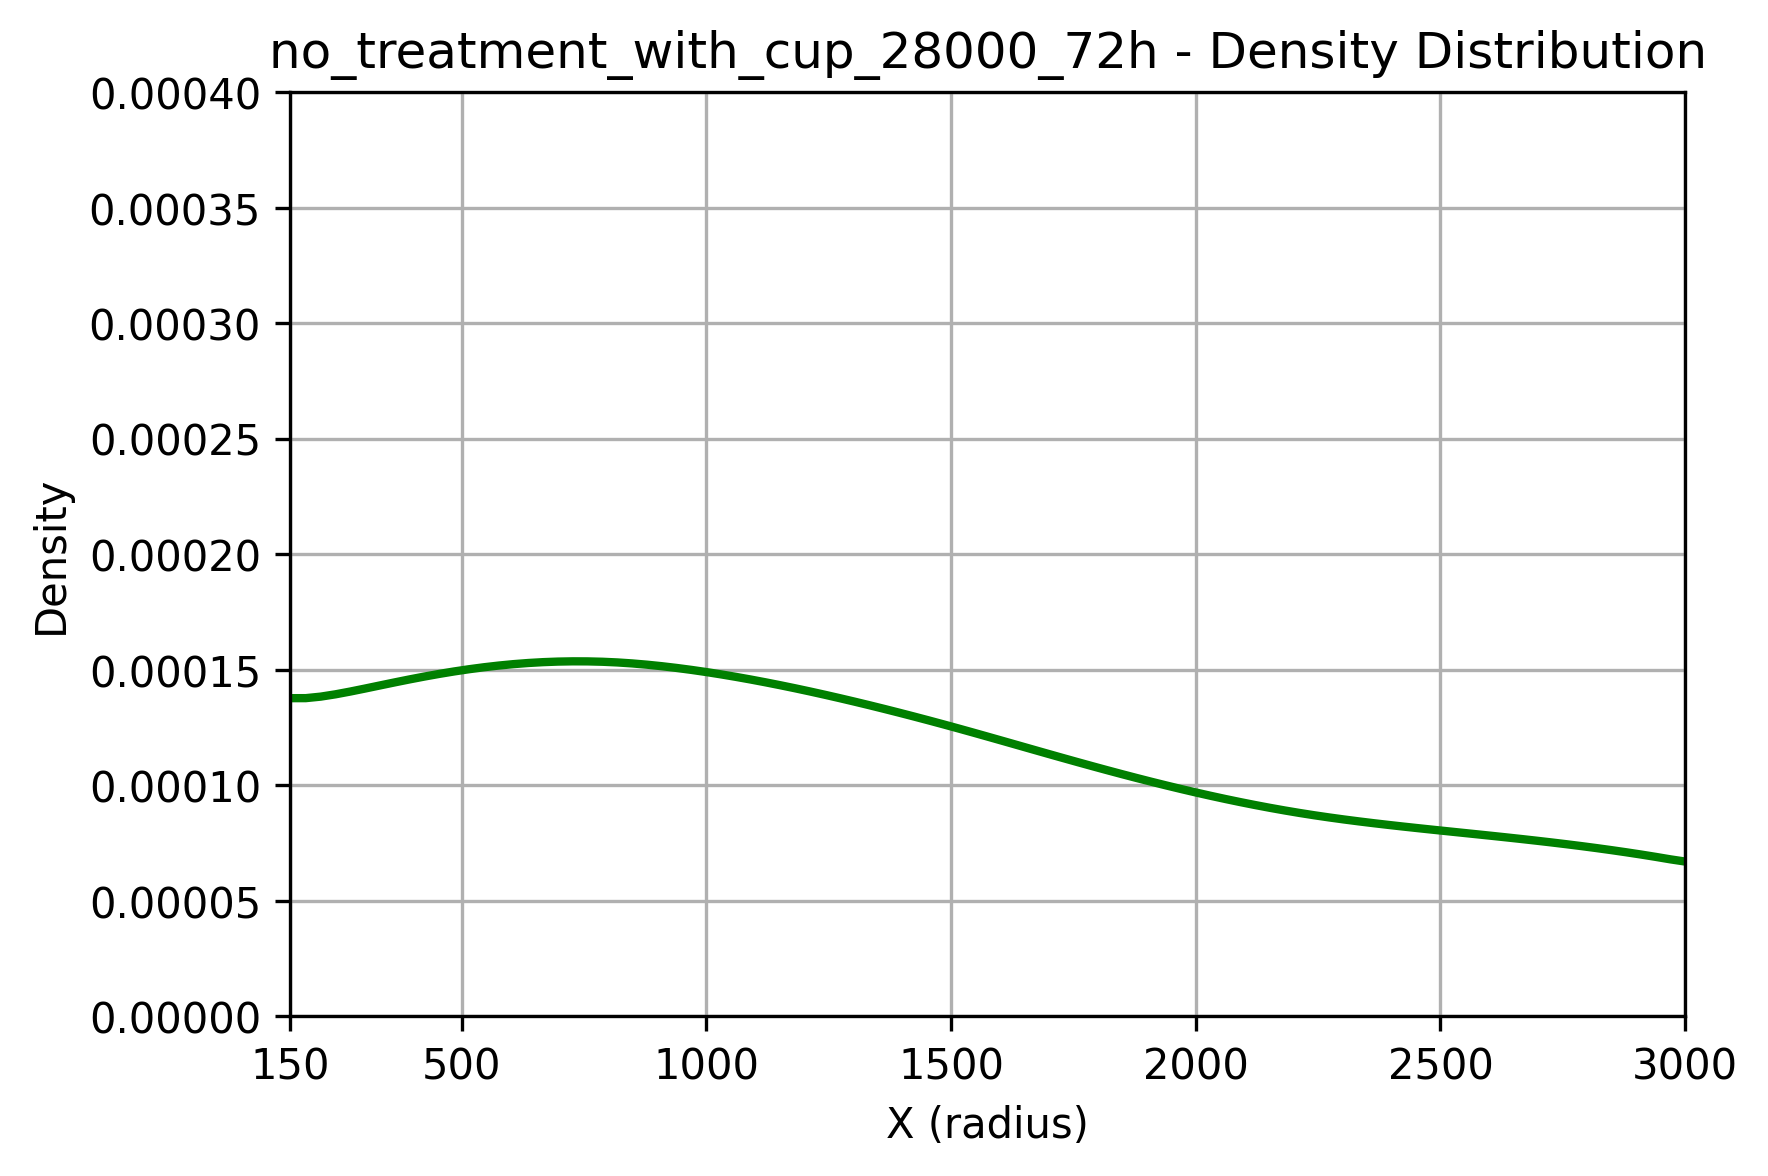
All CARTopiaX plots below show the mean and standard deviation over around five stochastic runs. We focus on reproducing the key trends, since the biological process is highly stochastic and the error bars in the paper are very large.
Results
Oxygen gradient: 10 million cells/mL, with cap, no treatment
The first step was to verify that the model reproduces the oxygen gradient created by the cap. The paper reports oxygen levels measured with sensors (orange), together with a simple differential equation model developed by the authors (blue), which is unrelated to CARTopiaX.
In CARTopiaX, oxygen flows in from the border of the cylinder (3000 µm) and is consumed by the cells, producing a decreasing oxygen profile towards the center that closely matches the experimental measurements after 24 hours.
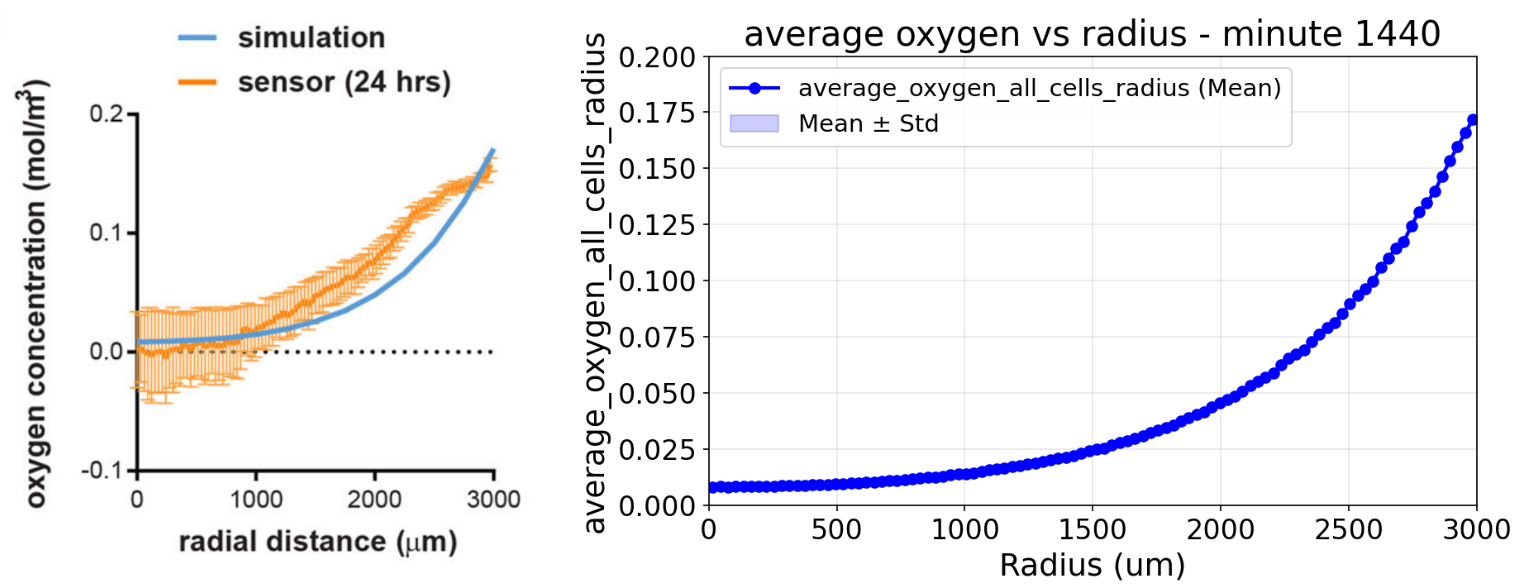
Left: oxygen profile reported by Ando et al. (2019). Right: CARTopiaX oxygen profile at minute 1440 (24 hours).
No treatment, without cap (normoxia)
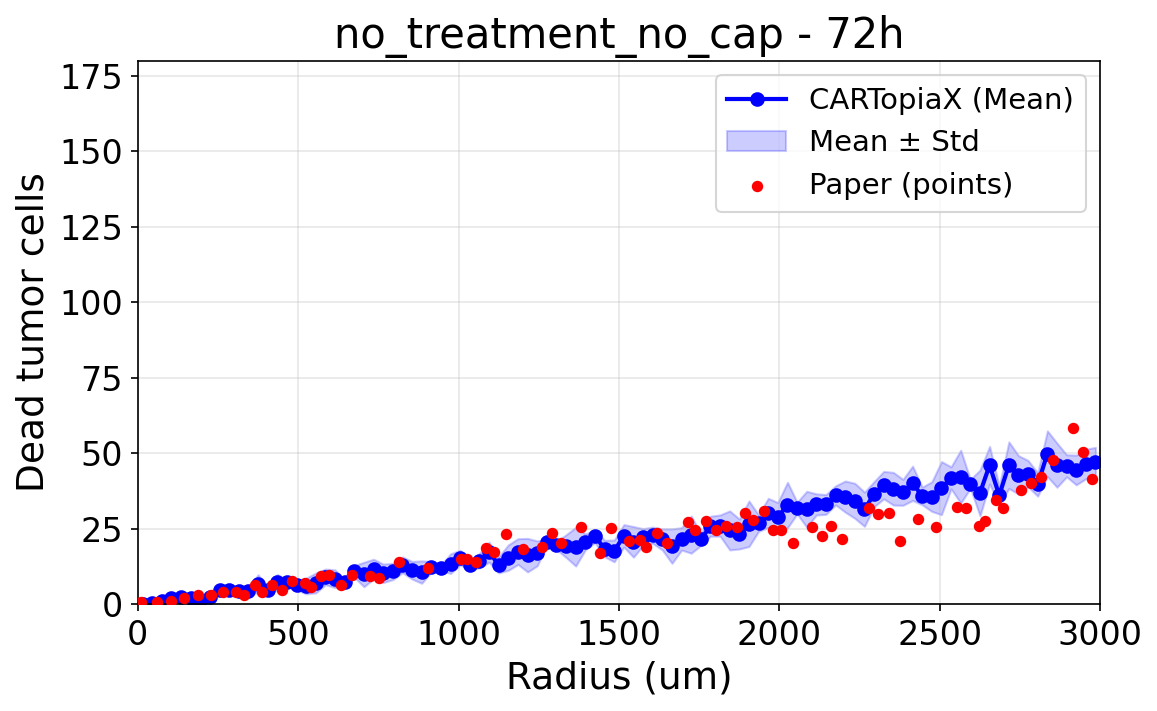
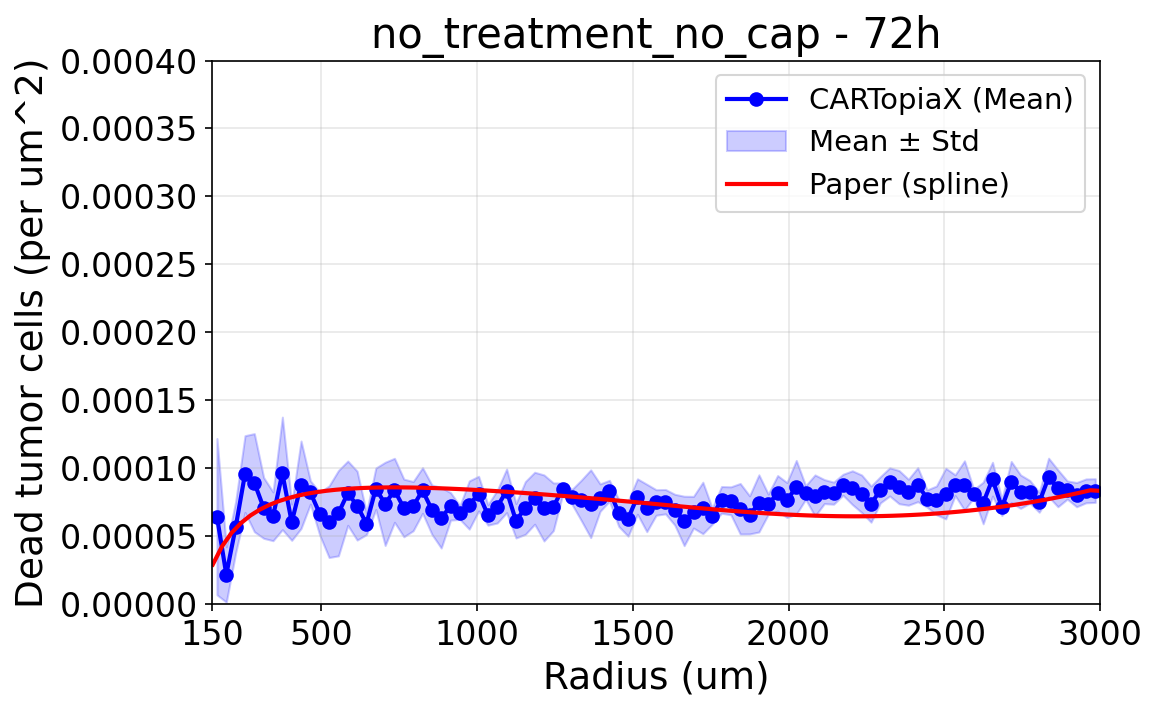
Without the cap, oxygen can enter the whole tumor, so the environmental conditions are perfectly symmetric and cell death is uniform across the tumor. The absolute number of dead cells grows with the radius only because outer rings are larger, as the area-normalized plot shows.
No treatment, with cap (hypoxia)
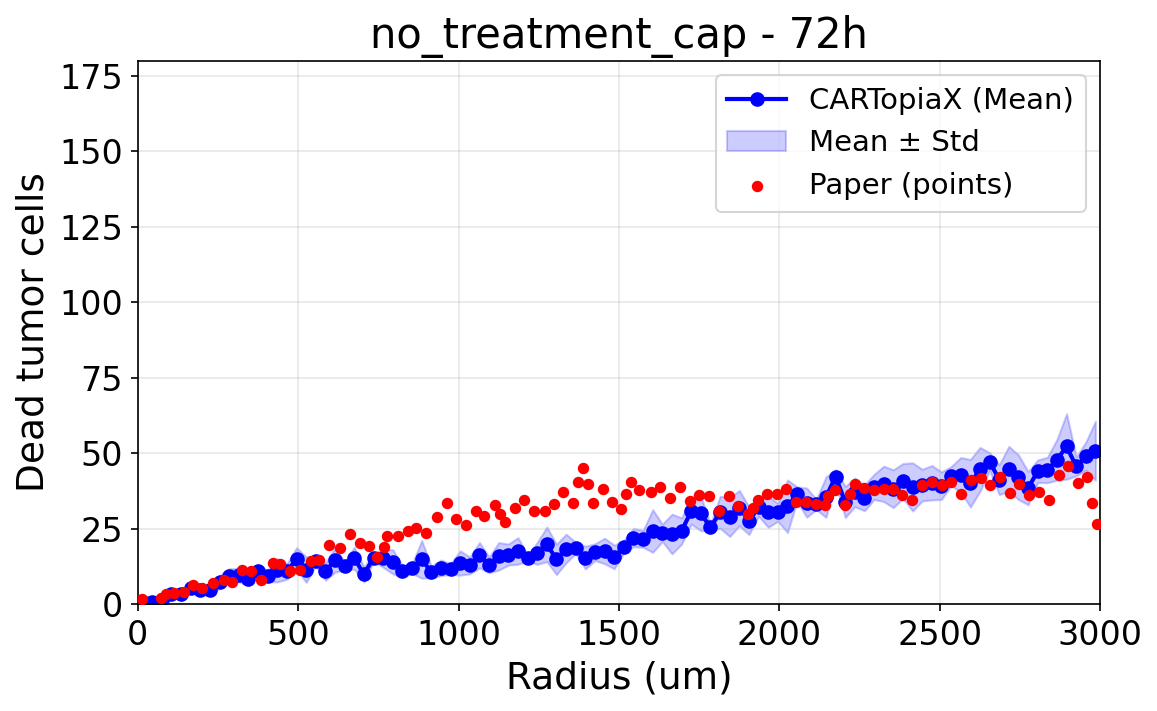
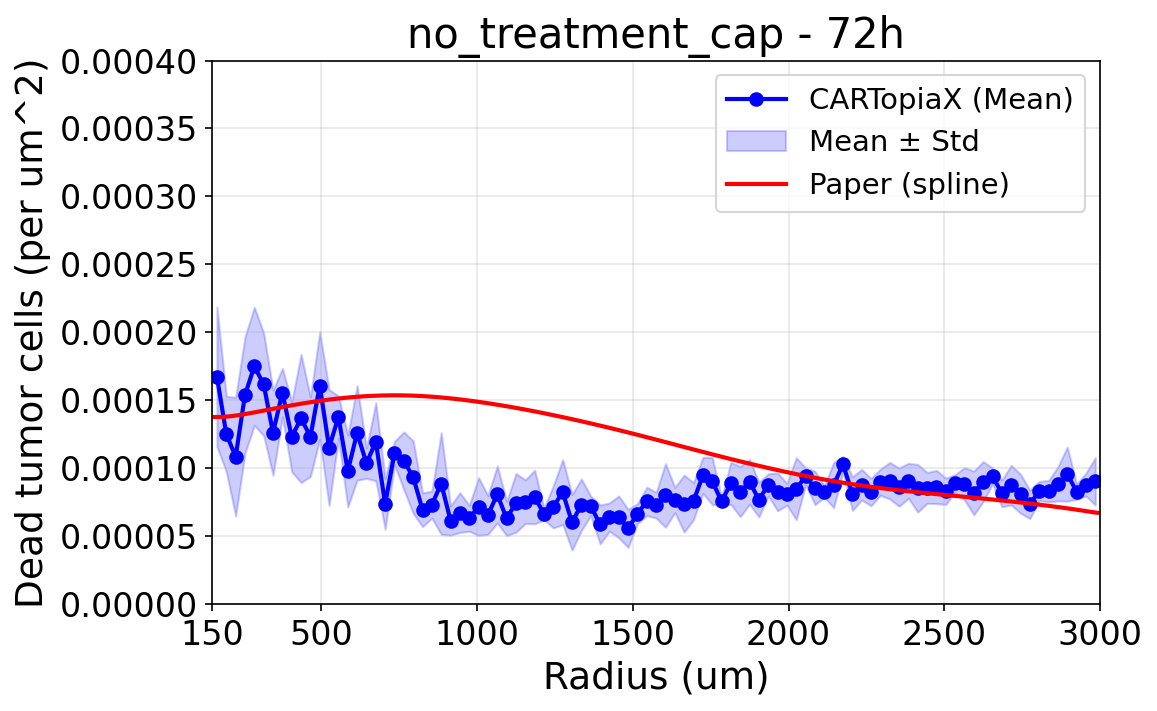
Since oxygen now flows in only from the edges, the cap creates a hypoxic region in the center of the cylinder, which increases cell death in the core, as observed in the experiments.
Glucose starvation kills cells
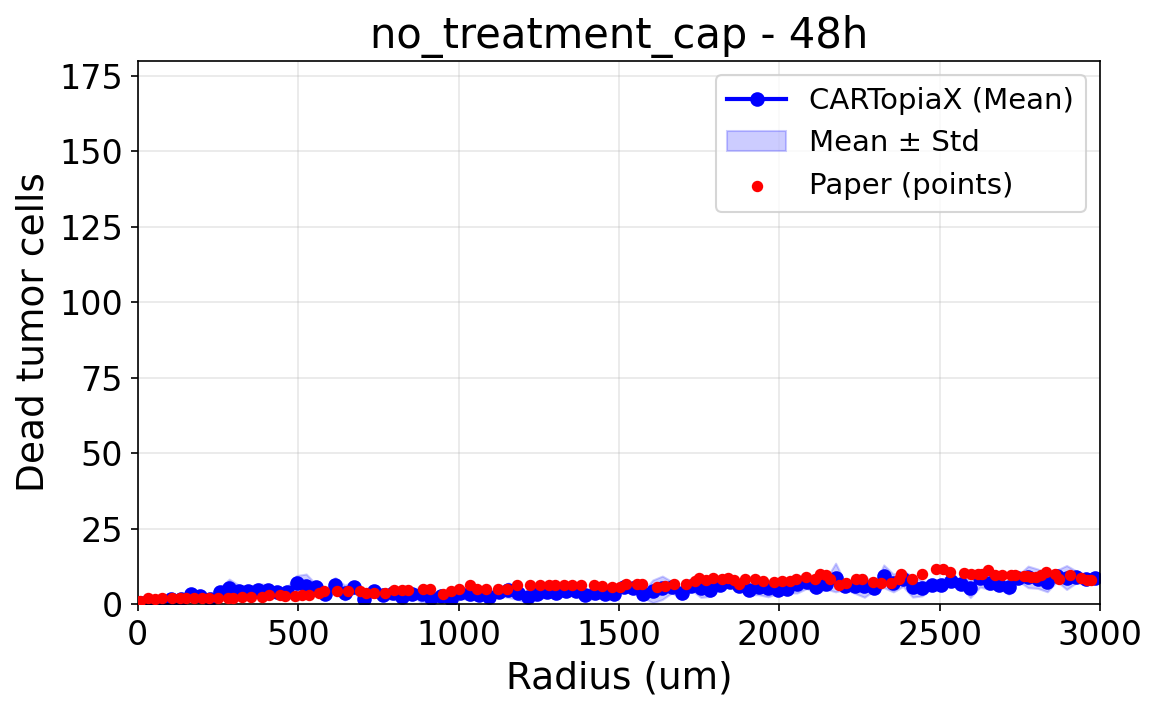
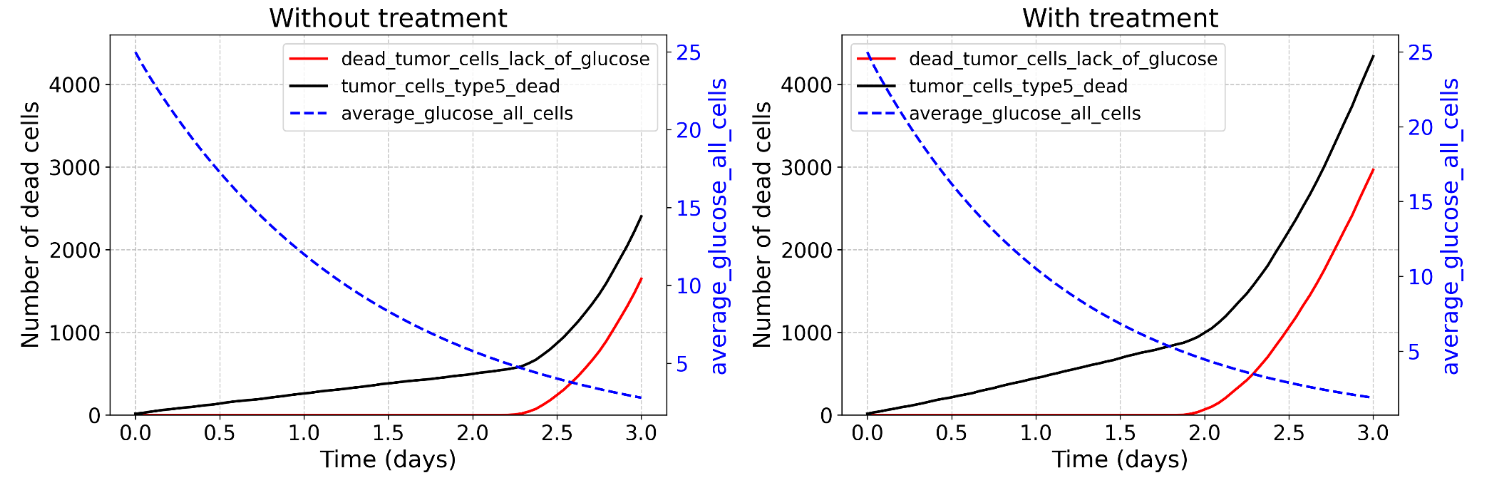
In the experiments, many more cells are dead by day 3 than by day 2. The device used by the researchers contains medium with glucose to feed the cells, and since it is not replaced during the experiment, glucose is progressively depleted. In CARTopiaX, this depletion explains the sharp increase in cell death during the last day.
CAR T-cells starve cancer cells
The following plots show the average glucose level and the number of dead tumor cells over time, with and without treatment. Without treatment, cells start dying from lack of glucose after around 2.25 days. When treatment is added, CAR T-cells also consume glucose, so it is depleted faster: cells start dying from glucose starvation earlier, and the total number of dead tumor cells by day 3 is much higher (around 4,300 instead of 2,400).
This mechanism contributes to what the authors call “non-contact mediated” CAR T-cell cytotoxicity: CAR T-cells kill cancer cells that they never touch, simply by competing with them for nutrients.
20:1 treatment, without cap (normoxia)
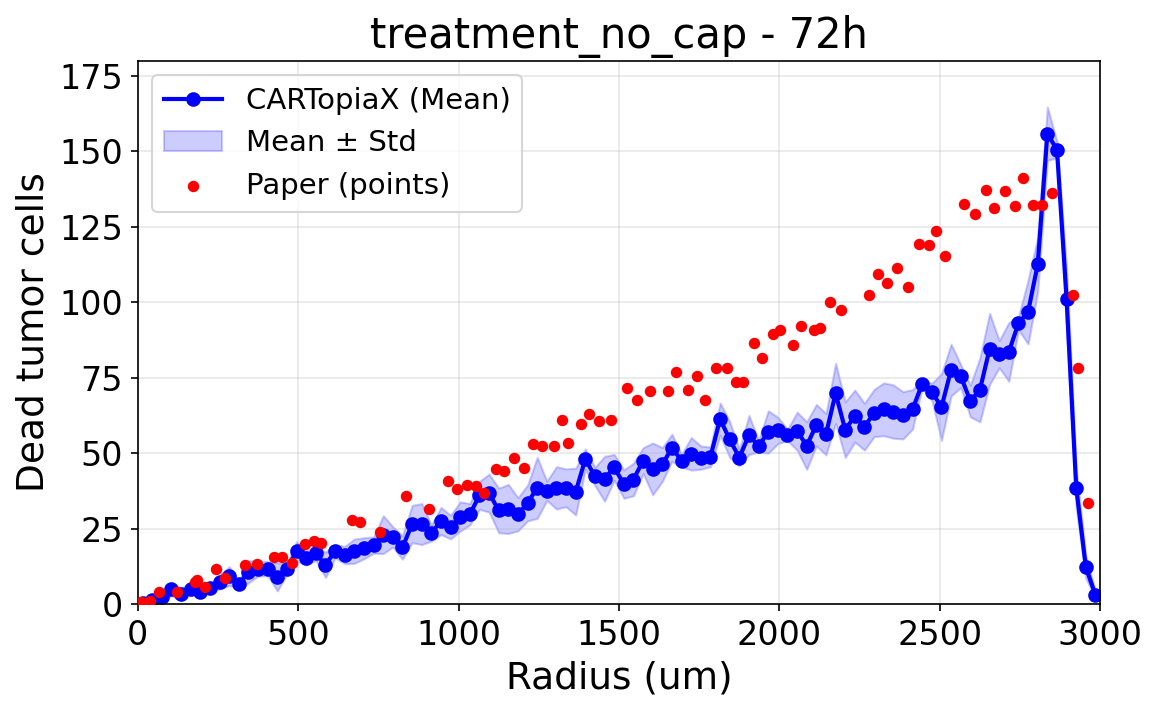
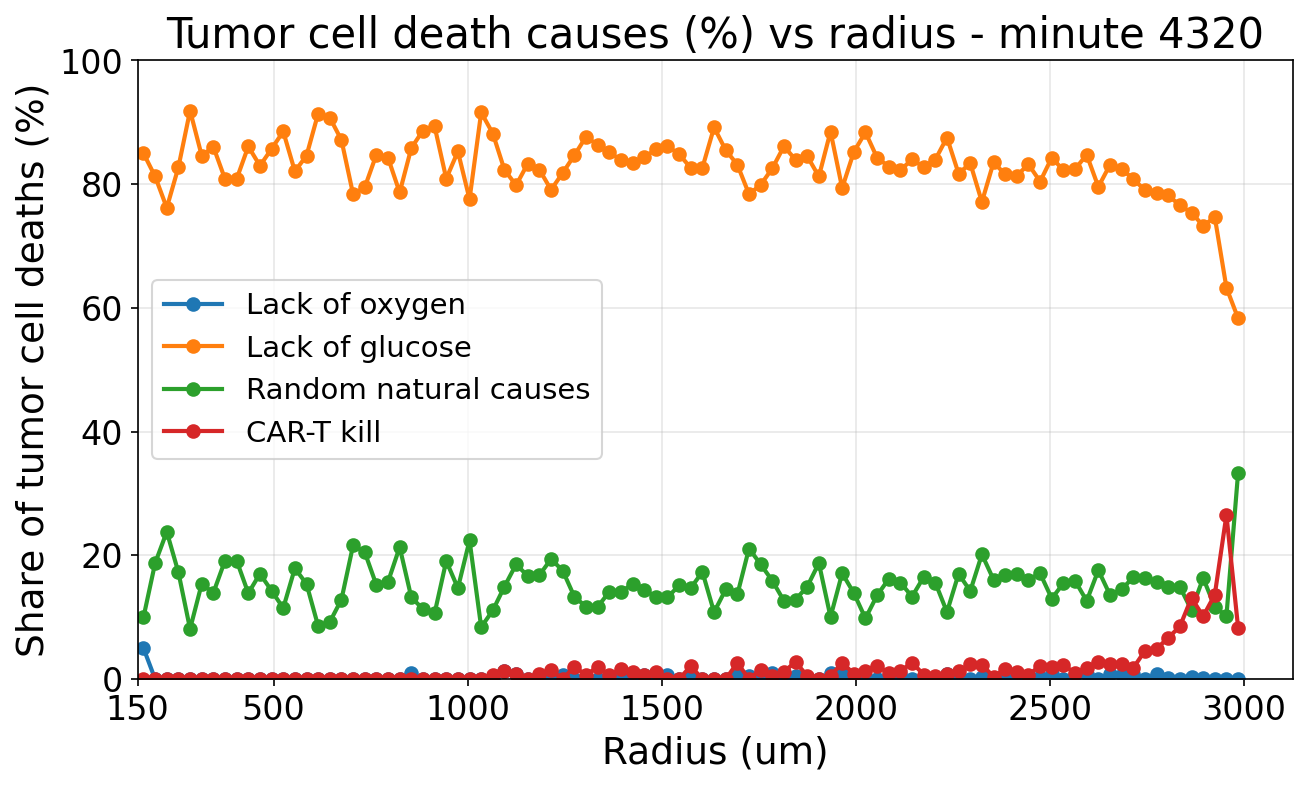
With CAR T-cell treatment and no cap, cell death is uniform across the tumor, except at the edge, where CAR T-cells target and kill tumor cells.
Unexpected emergent behavior: cancer cell deaths drop at a radius of 3000 µm. This was not explicitly programmed: a large number of CAR T-cells enter from the edges and push tumor cells toward the center, leaving fewer cancer cells at the very border. This drop is also visible in the experimental data.
Why do cancer cells die?
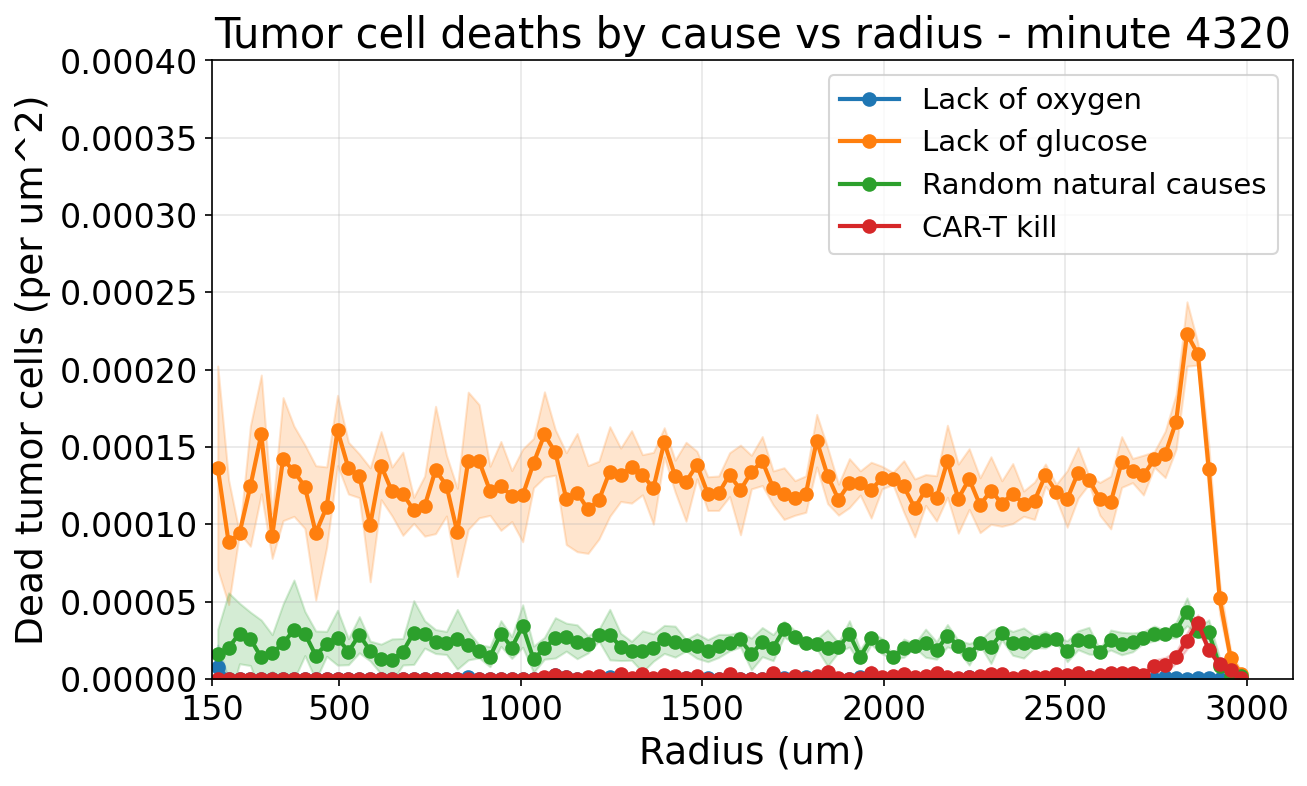
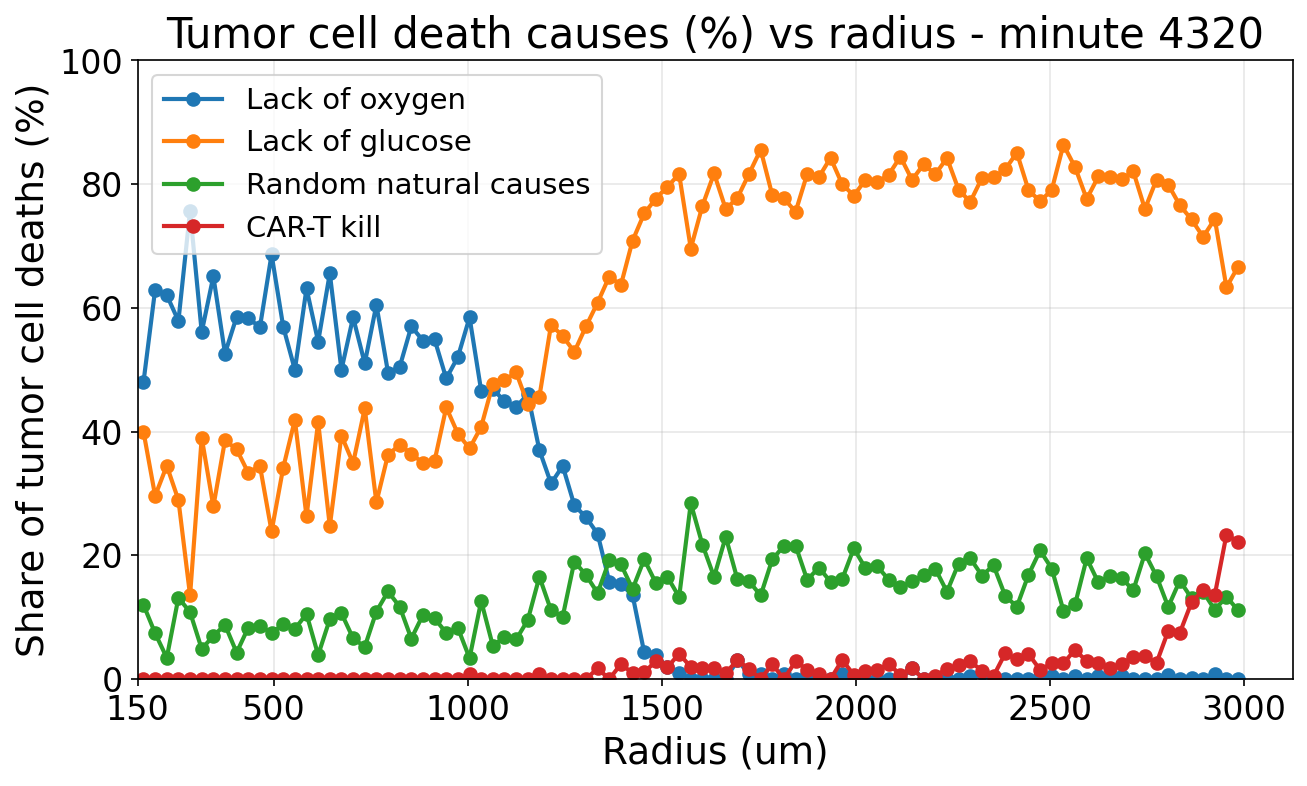
One of the main advantages of an ABM is that it provides information that is very hard to measure in the lab, such as the cause of death of each cell. The following plots show the deaths by cause and the share of each cause as a function of the radius, after 72 hours:
- CAR T-cells barely infiltrate the tumor, as reported in the paper, so very few cancer cells are killed directly by them, and only near the edge.
- Most cancer cell deaths are caused by glucose deprivation (around 80% across most of the tumor), which is exacerbated by glucose consumption by CAR T-cells.
20:1 treatment, with cap (hypoxia)
When the cap is added to the treated tumor:
- Again, more cells die in the core due to oxygen deprivation, which is the main cause of death within the inner ~1200 µm. CAR T-cells also consume oxygen, further exacerbating the situation at the center.
- In the rest of the tumor, glucose deprivation remains the main cause of death.
- At the edges, CAR T-cells push and kill cancer cells, as before.
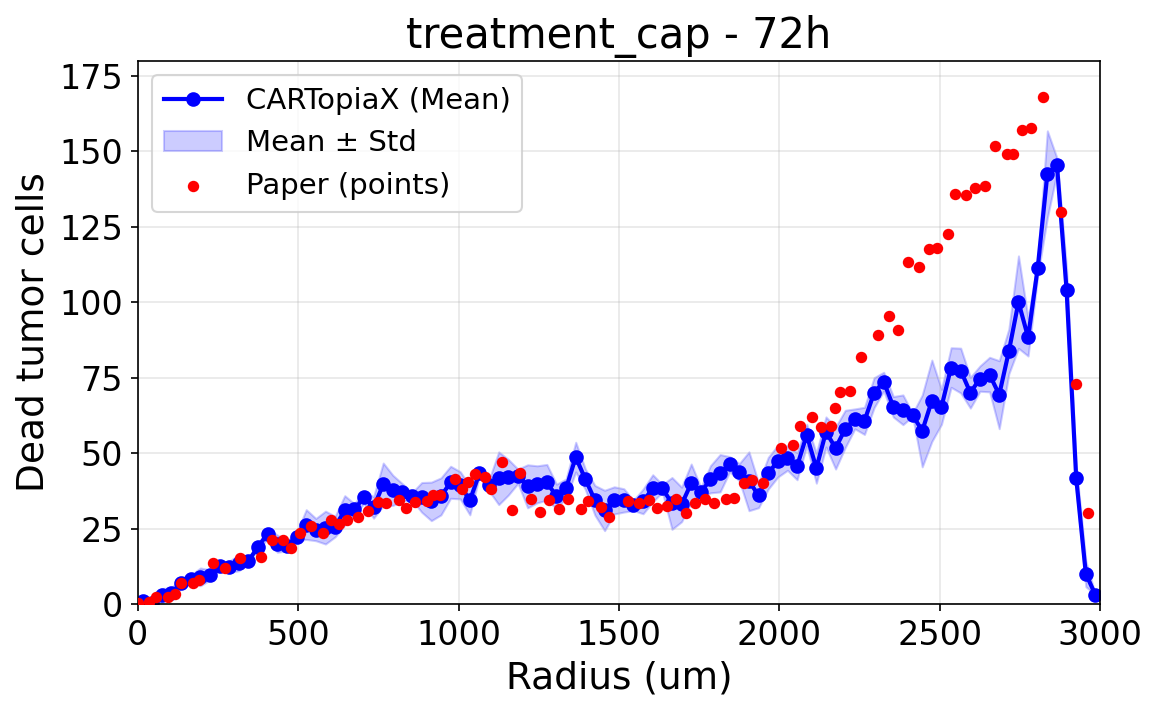
As a result, cell death increases both at the core and at the edges, producing a U-shaped profile of dead cells, with a drop at a radius of 3000 µm due to the CAR T-cells pushing cancer cells inward. CARTopiaX closely reproduces this U-shaped profile observed in the paper.
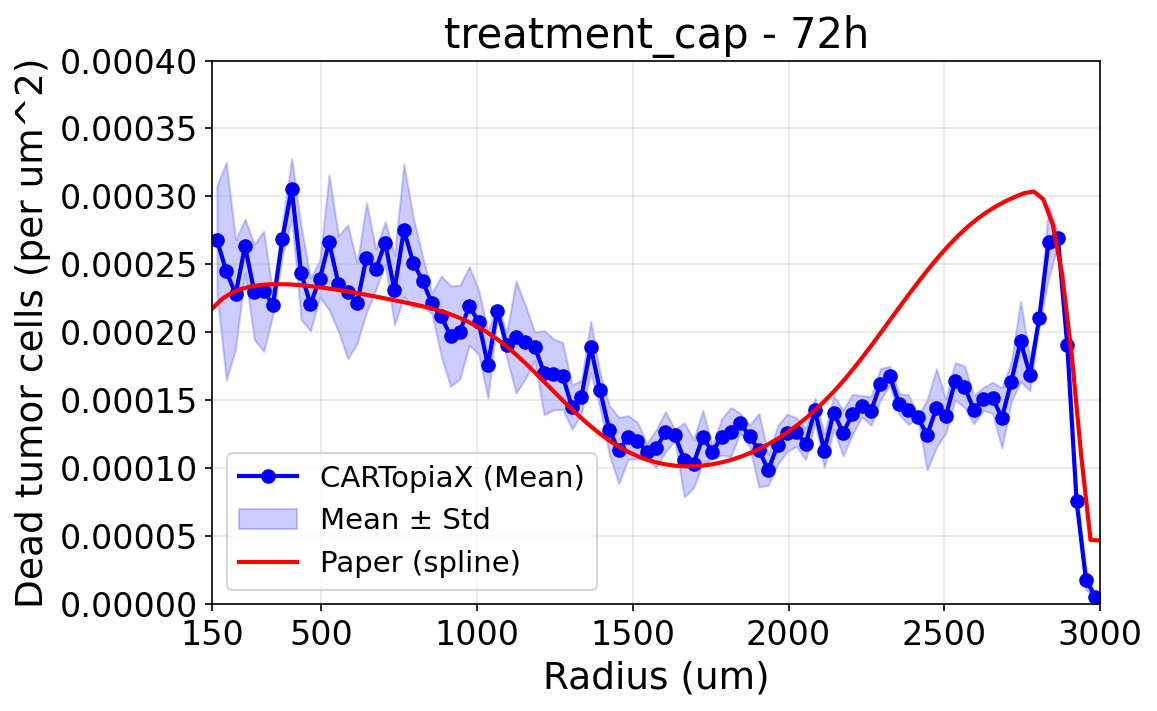
20:1 treatment: cell deaths in the middle region, with vs. without the cap
Comparing both treated scenarios reveals another subtle trend, present both in the paper and in CARTopiaX:
- More cells die between radii 1400 and 2500 µm when there is no cap.
- Without the cap, more oxygen is available, allowing cells to proliferate more, which consequently increases the number of cell deaths.
- This does not happen at the core because, with the cap, oxygen levels are so low that cells not only stop proliferating but also die much more frequently.
- At the edges, oxygen levels are sufficiently high in both cases, so cell death rates remain similar.
Low density: 1 million cells/mL, no treatment
Finally, the experiment was repeated with a ten times lower cell density. With very few cells present, oxygen consumption is low, so both the normoxic (without cap) and hypoxic (with cap) conditions are effectively normoxic, resulting in no significant differences between them. In addition, since there are far fewer cells, they do not run out of glucose, and very few cells die. CARTopiaX reproduces this behavior as well.
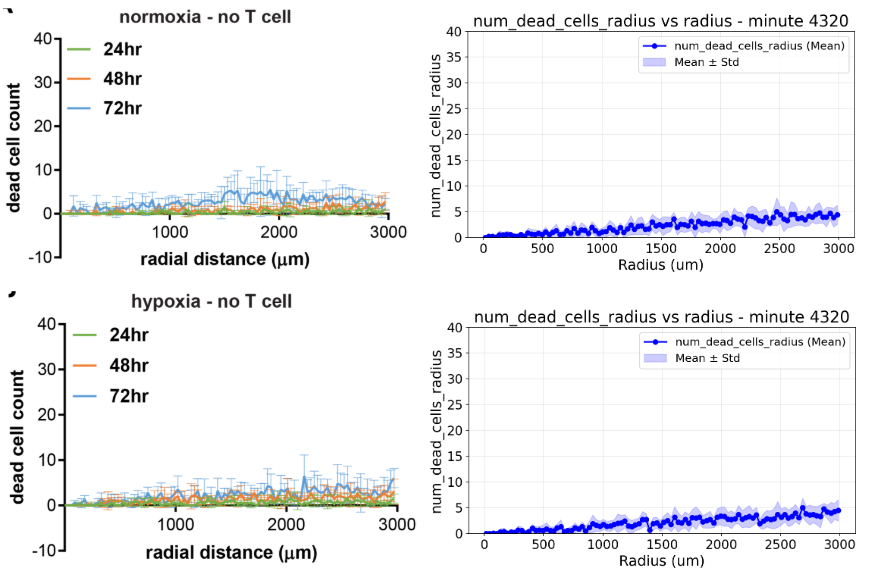
Left: results reported by Ando et al. (2019). Right: CARTopiaX, without cap (top) and with cap (bottom).
Automated Model Calibration with Bayesian Optimization
Many parameters of the model cannot be measured in the lab or found in the biological literature, and each simulation is computationally expensive, so trying every combination of parameters (grid search) is not feasible.
To address this, I added a new calibration tool to the repository that automatically estimates the parameters that best reproduce experimental data:
- How it works: it uses Bayesian optimization through Optuna and its Tree-structured Parzen Estimator (TPE). TPE builds a probabilistic surrogate from all previous trials, separating the parameter values that gave good results from the ones that gave bad results. The next trial is sampled where good values are more likely, balancing exploration and exploitation to minimize the number of costly simulations.
- Robust to noise: since the model is stochastic, each candidate is evaluated over multiple Monte Carlo runs with different random seeds, and the error is averaged.
- Flexible loss functions: the error can be computed on whole-tumor time series (e.g., average oxygen or tumor radius over time), on radial profiles at a fixed time, or with a user-defined function.
- Ready to use: results are stored in a persistent study, so optimization runs can be resumed or extended.
Conclusion
During this GSoC, CARTopiaX was extended to replicate a new wet-lab scenario, with a completely new tumor geometry, glucose as a new diffusing substance, and new cell behaviors and mechanics, together with a new Bayesian optimization tool for model calibration.
The extended model reproduces the key trends of the paper, including emergent behaviors that were not explicitly programmed, such as CAR T-cells pushing cancer cells inward. Moreover, it offers an in silico explanation of the “non-contact mediated” CAR T-cell cytotoxicity observed by the authors: glucose and oxygen competition between CAR T-cells and cancer cells. This explanation relies on data that is very hard to measure in the lab, such as the causes of death per radius.
Altogether, this work shows that CARTopiaX is a flexible platform for fast, low-cost hypothesis testing of CAR T-cell therapies, able to provide insights that cannot always be obtained experimentally.
Related Links
- Project Repository
- GSoC 2025 Wrap-up Blog Post
- BioDynaMo Repository
- Ando, Y., Siegler, E.L., Ta, H.P. et al. Evaluating CAR-T Cell Therapy in a Hypoxic 3D Tumor Model. Adv Healthc Mater 8(5), e1900001 (2019). DOI
- Luque, L.M., Carlevaro, C.M., Rodriguez-Lomba, E. et al. In silico study of heterogeneous tumour-derived organoid response to CAR T-cell therapy. Sci Rep 14, 12307 (2024). DOI
- My GitHub Profile