CARTopiaX: an Agent-Based Simulation of CAR T-Cell Therapy built on BioDynaMo
Project Overview
CAR T-cell therapy is a form of cancer immunotherapy that engineers a patient’s T cells to recognize and destroy malignant cells. While this approach has achieved remarkable success in treating blood cancers, it faces significant challenges in solid tumors due to the complexity and heterogeneity of their microenvironments.
CARTopiaX is an agent-based model designed to simulate the behavior of tumour-derived organoids which are lab-grown models that mimic real solid tumor environments and their response to CAR T-cell therapy. The project aims to bridge the gap between laboratory experiments and computational biology by developing a high-fidelity in silico digital twin of tumor-derived organoids for studying solid tumor dynamics and immunotherapy outcomes.
Built on BioDynaMo, a high-performance, open-source platform for large-scale biological modeling, CARTopiaX enables researchers to:
- Recreate realistic in vitro conditions for tumor growth.
- Introduce CAR T-cells and evaluate their efficacy in heterogeneous, solid tumor microenvironments.
- Explore different therapeutic strategies and parameter variations.
- Assess treatment outcomes such as tumor reduction, elimination, or relapse risk.
CARTopiaX implements the mathematical framework described in the Nature publication “In silico study of heterogeneous tumour-derived organoid response to CAR T-cell therapy”, successfully replicating its key results and extending them through improved scalability and performance.
Project Highlights:
- Performance: Simulations run more than twice as fast as previous existing model, enabling rapid scenario exploration and hypothesis validation.
- Software Quality: Developed in C++ following robust software engineering practices, ensuring high-quality, maintainable, and efficient code.
- Architecture: Designed to be scalable, modular, and extensible, fostering collaboration, customization, and continuous evolution within an open-source ecosystem.
Model Replication
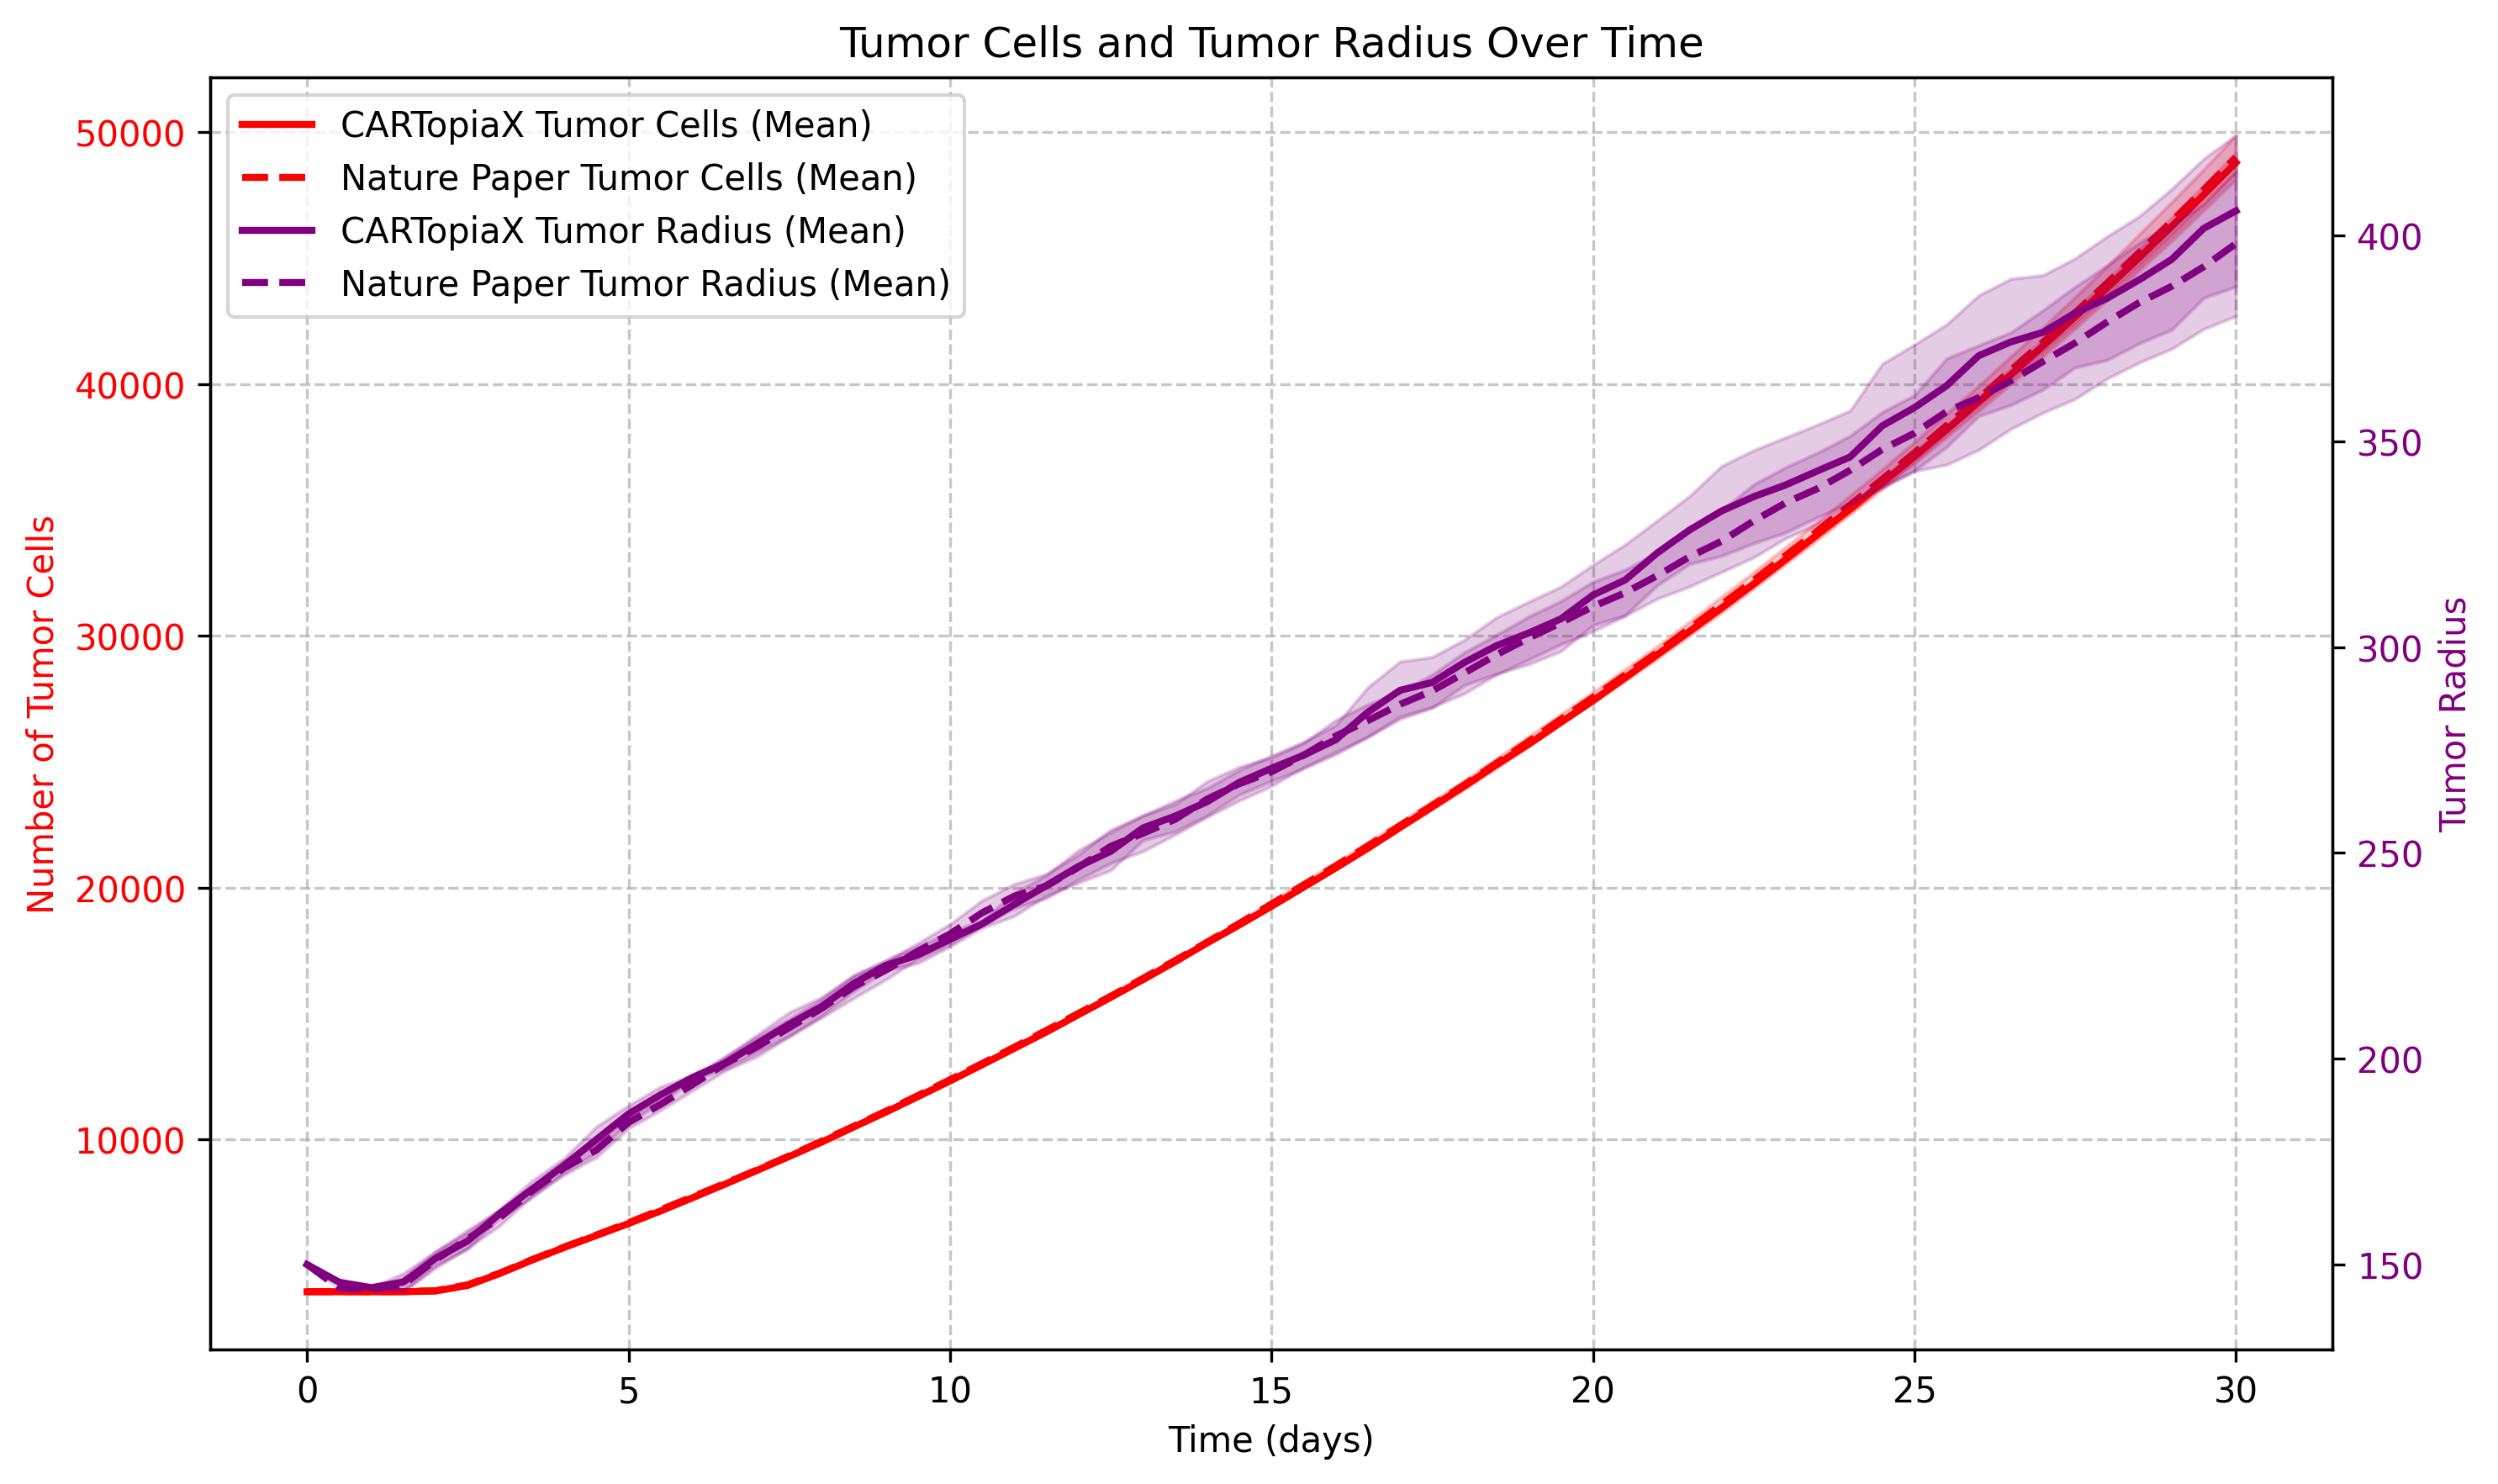
All plots in this section compare CARTopiaX with the model results from the Nature paper over five runs, demonstrating successful replication and reproducing the same biological findings. Even though the graphs do not always overlap, this is due to substantial known differences in their modeling approaches and stochastic nature. What is important is that the overall behaviors and key biological dynamics are accurately reproduced, as researchers primarily focus on these trends and peak responses when designing treatments.
Replication Example: Tumor with no CAR-T treatment
The following example reproduces the 30-day evolution of a 150 µm radius tumor simulation with no CAR T-cell treatment applied. The plot below shows the total number of cancer cells and the tumor radius over time:
Tumor Heterogeneity:
CARTopiaX models a heterogeneous tumor, where cancer cells differ in their oncoprotein expression levels, representing varying proliferative capacities.
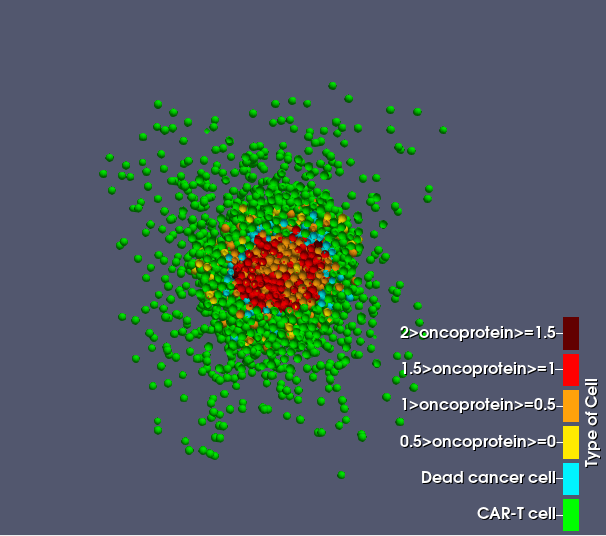
Although oncoprotein levels are continuous, cells are grouped into four discrete categories:
| Type | Oncoprotein Level | Aggressiveness |
|---|---|---|
| 1 | 1.5 < Oncoprotein ≤ 2 | Most proliferative |
| 2 | 1 < Oncoprotein ≤ 1.5 | Very proliferative |
| 3 | 0.5 < Oncoprotein ≤ 1 | Less proliferative |
| 4 | 0 ≤ Oncoprotein ≤ 0.5 | Least proliferative |
Tumor evolution visualized in ParaView:
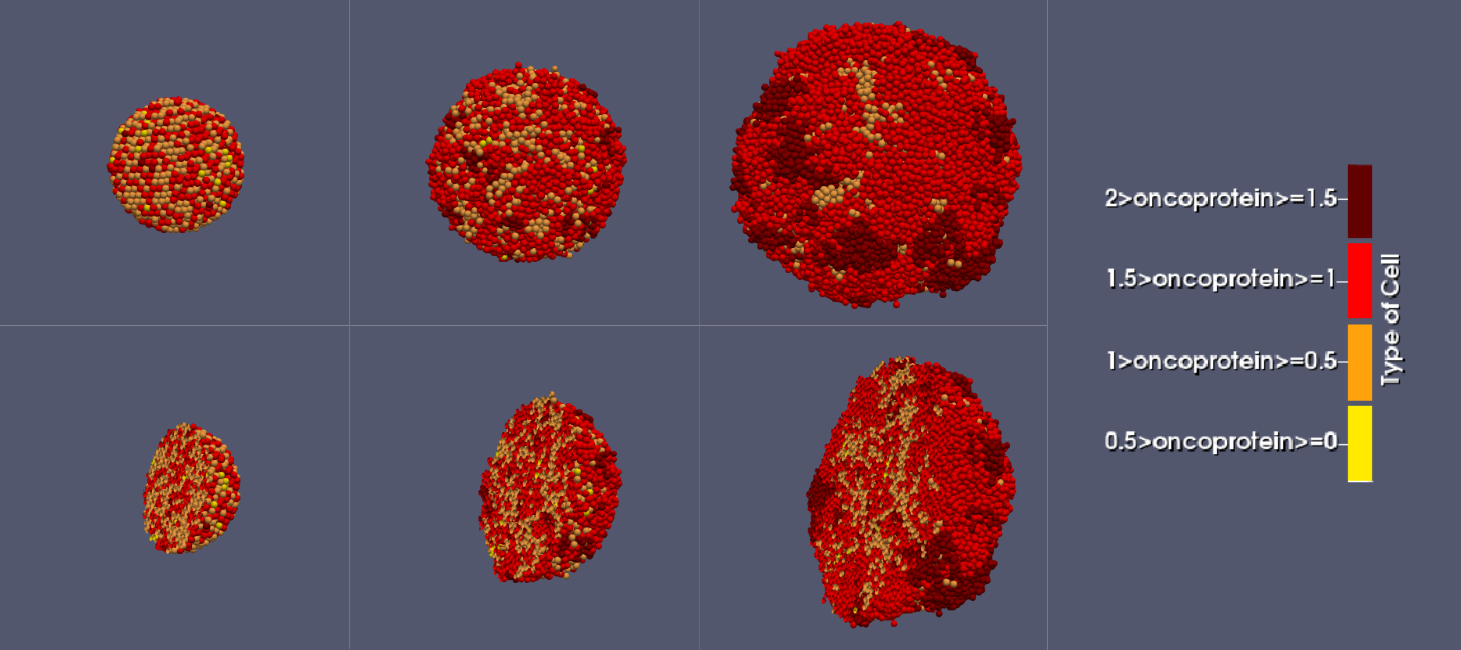
Type 1 cells are highly proliferative, causing their proportion in the tumor to increase, while Type 3–4 cells divide less frequently and, struggling in a oxygen-limited, resource-competitive environment, gradually become less common:
As cell quantity rises, oxygen levels drop due to increased consumption, while the average oncoprotein level gradually increases because more proliferative cells pass their higher oncoprotein levels to their progeny over time.
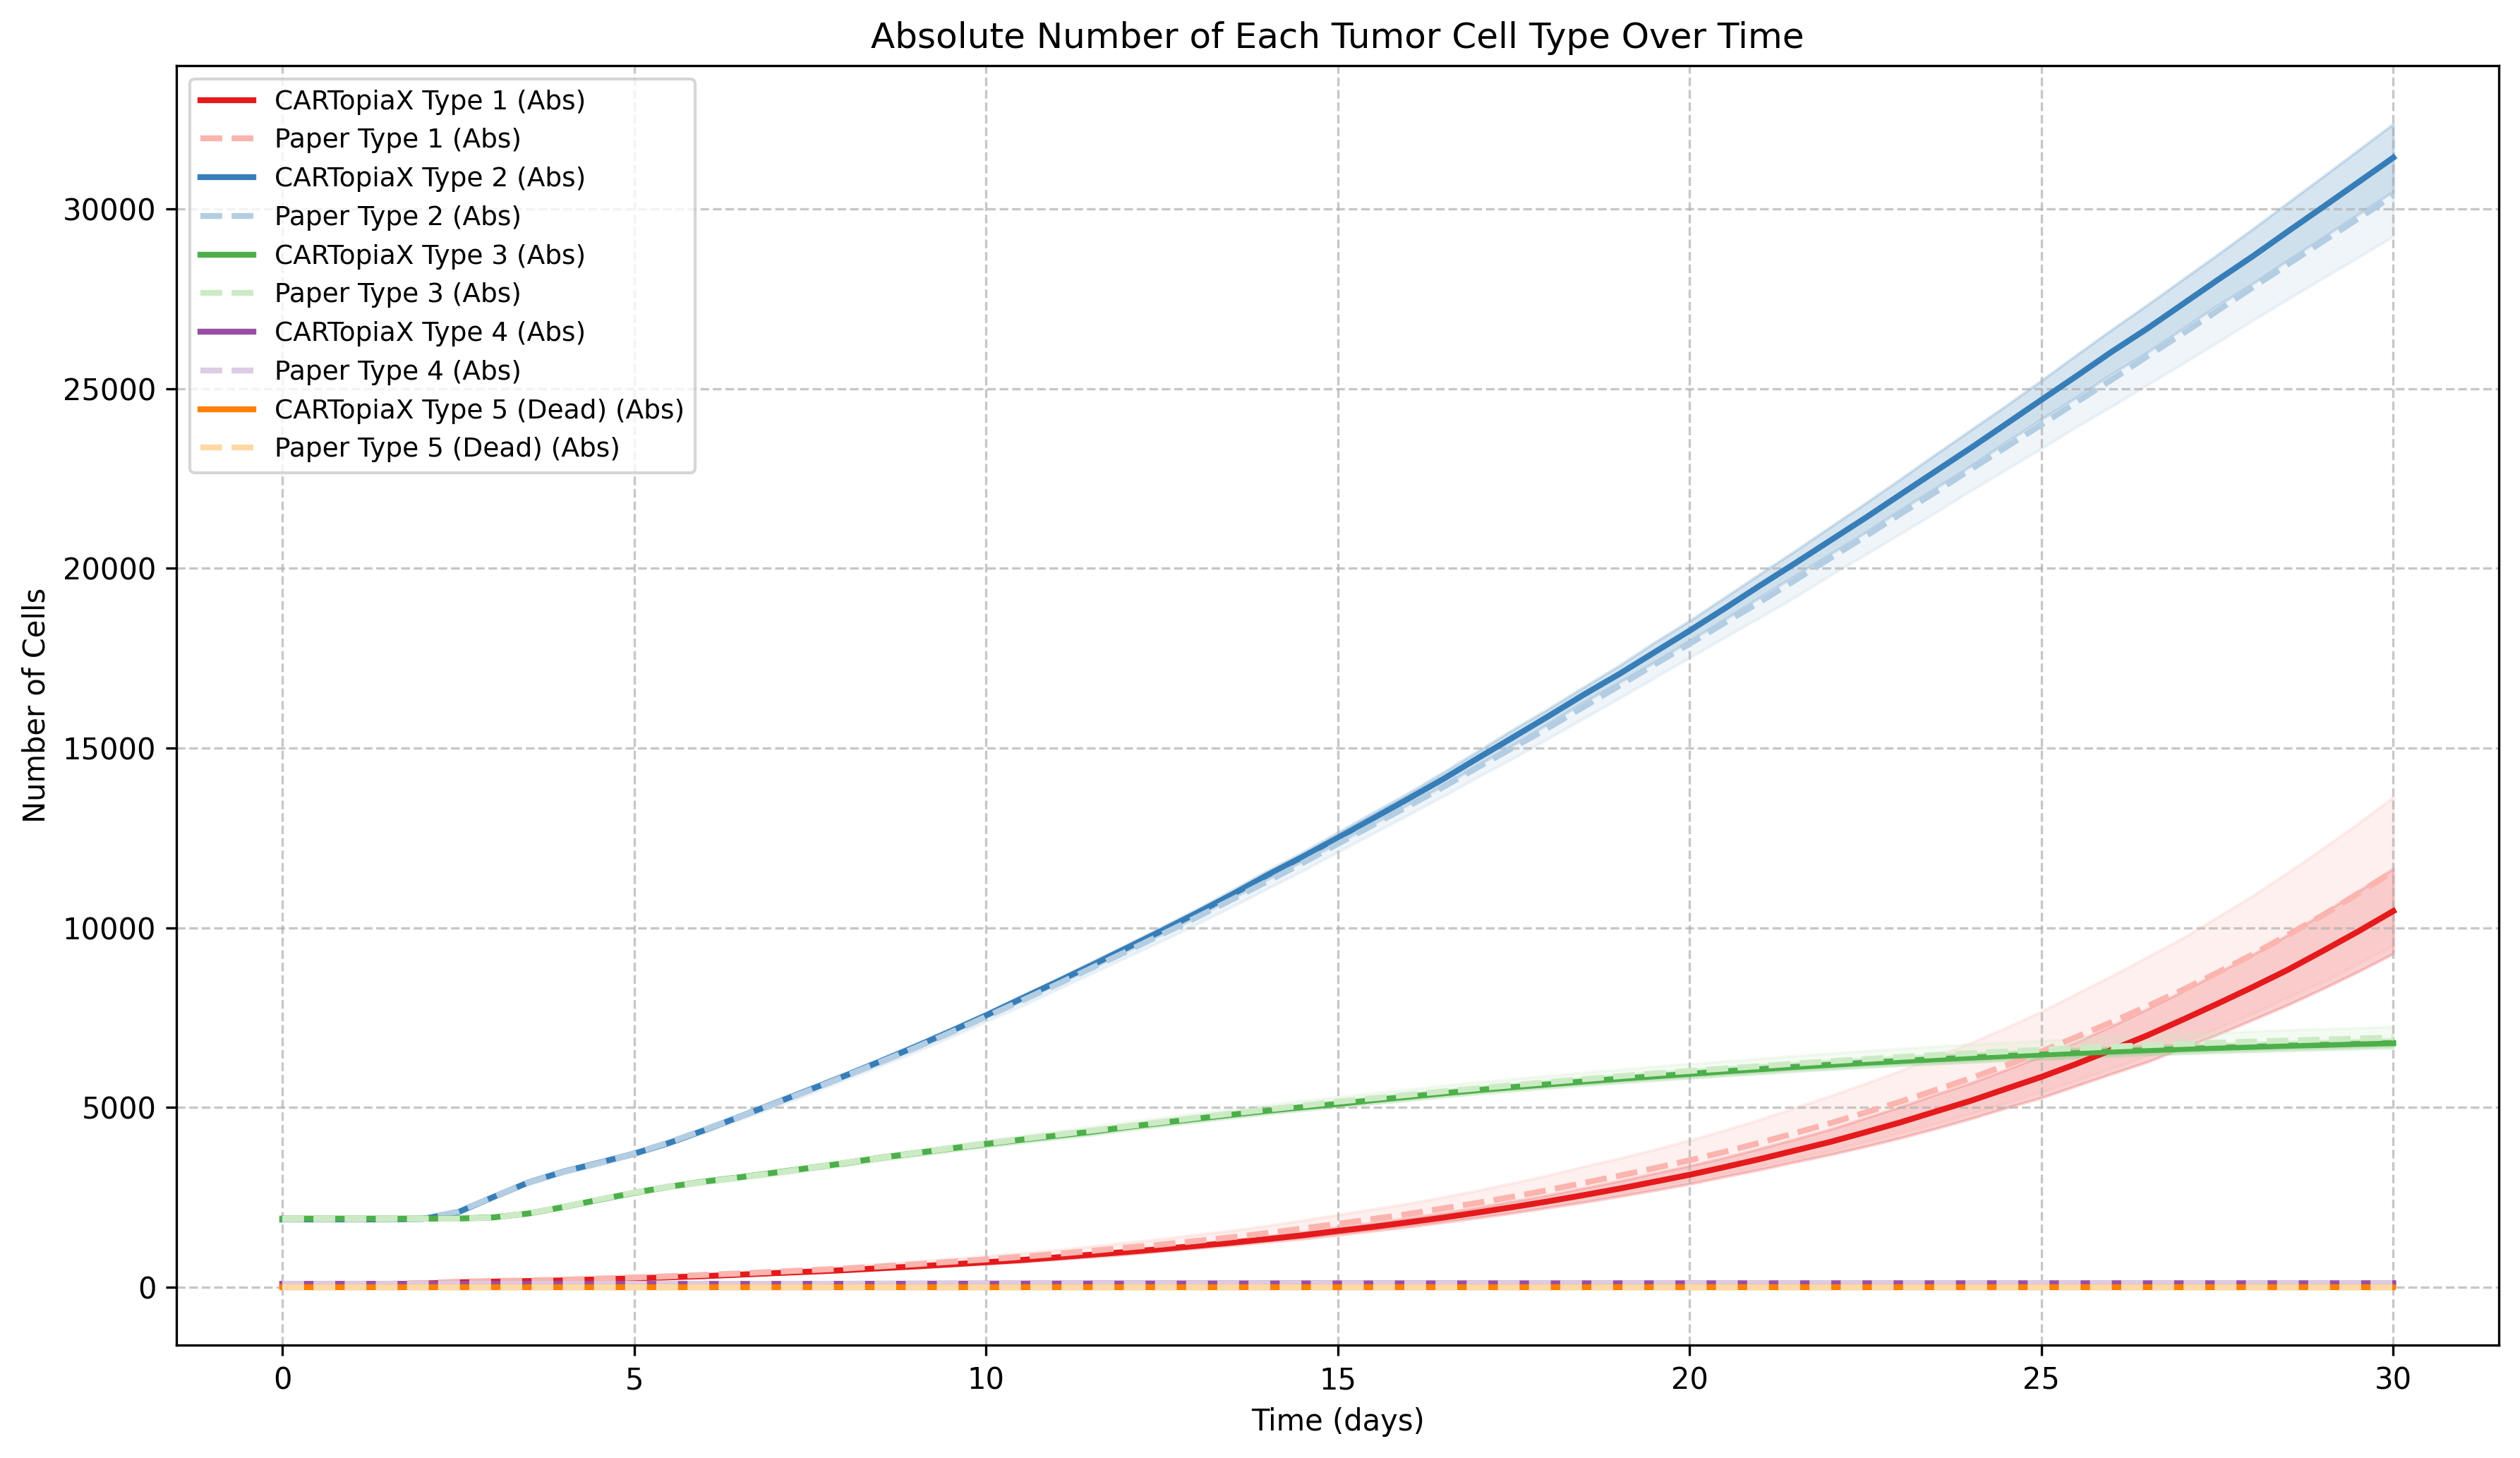
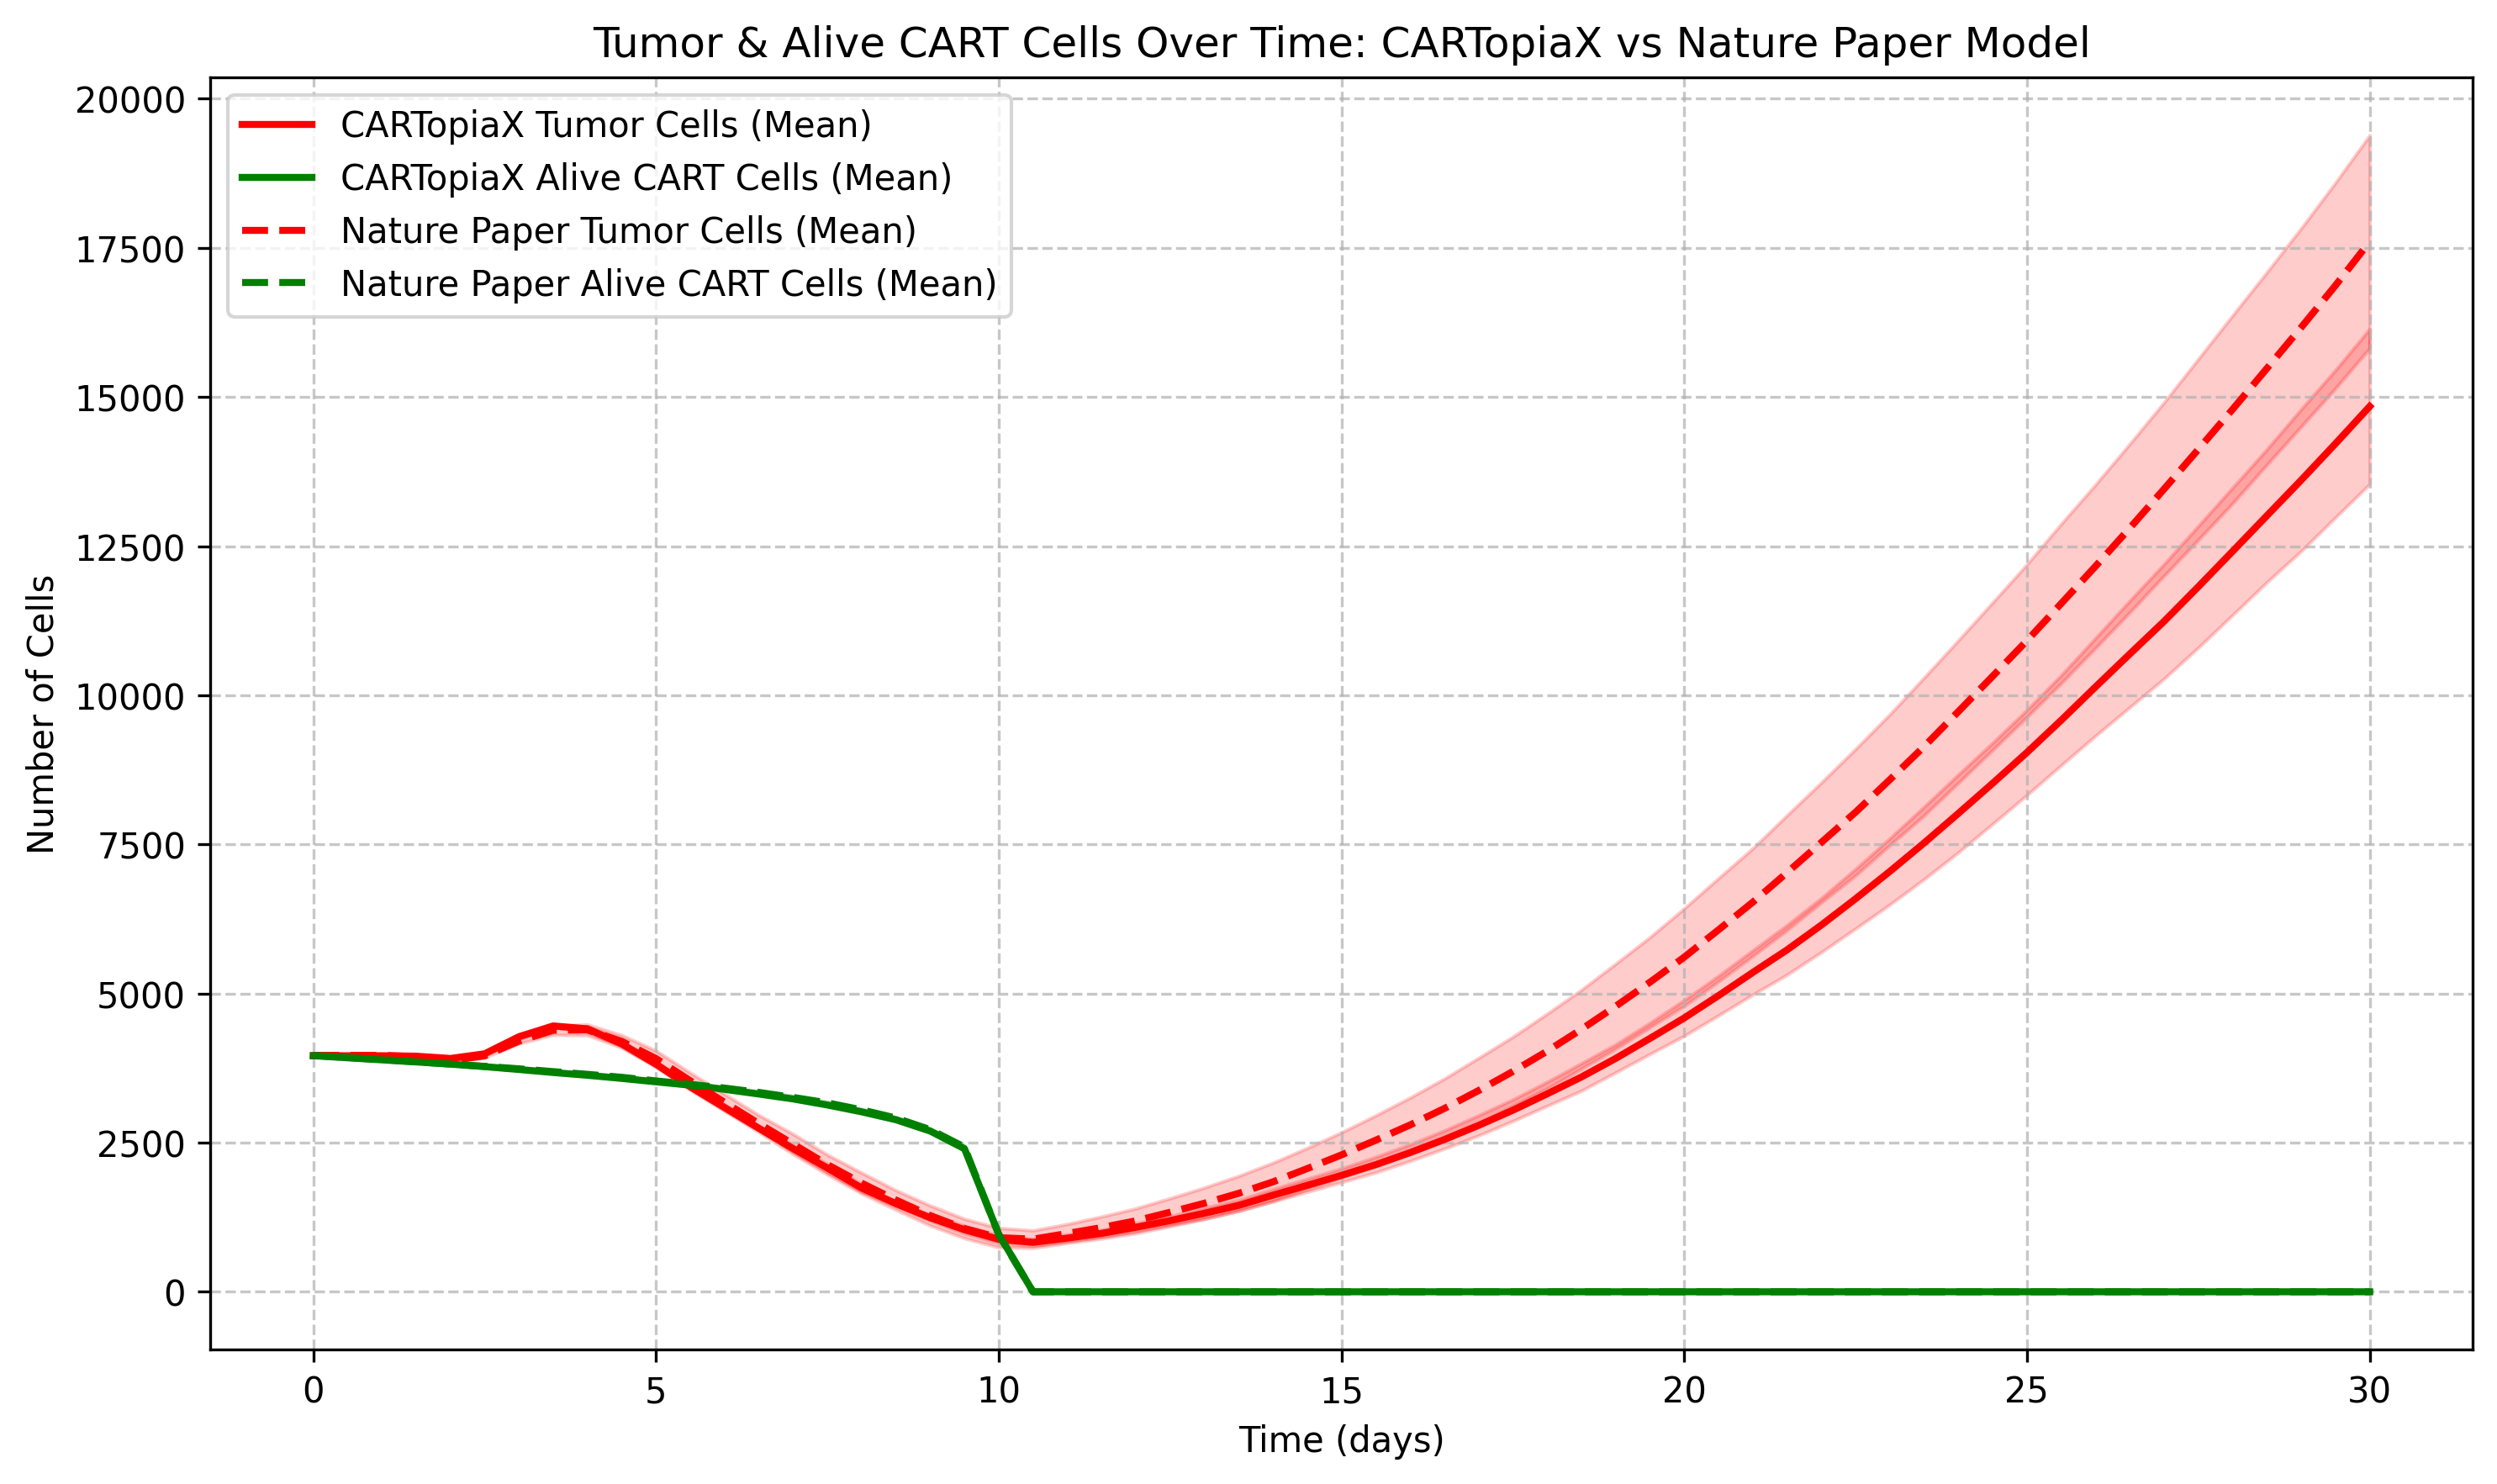
Replication Example: One CAR T-cell dose of Scale 1:1
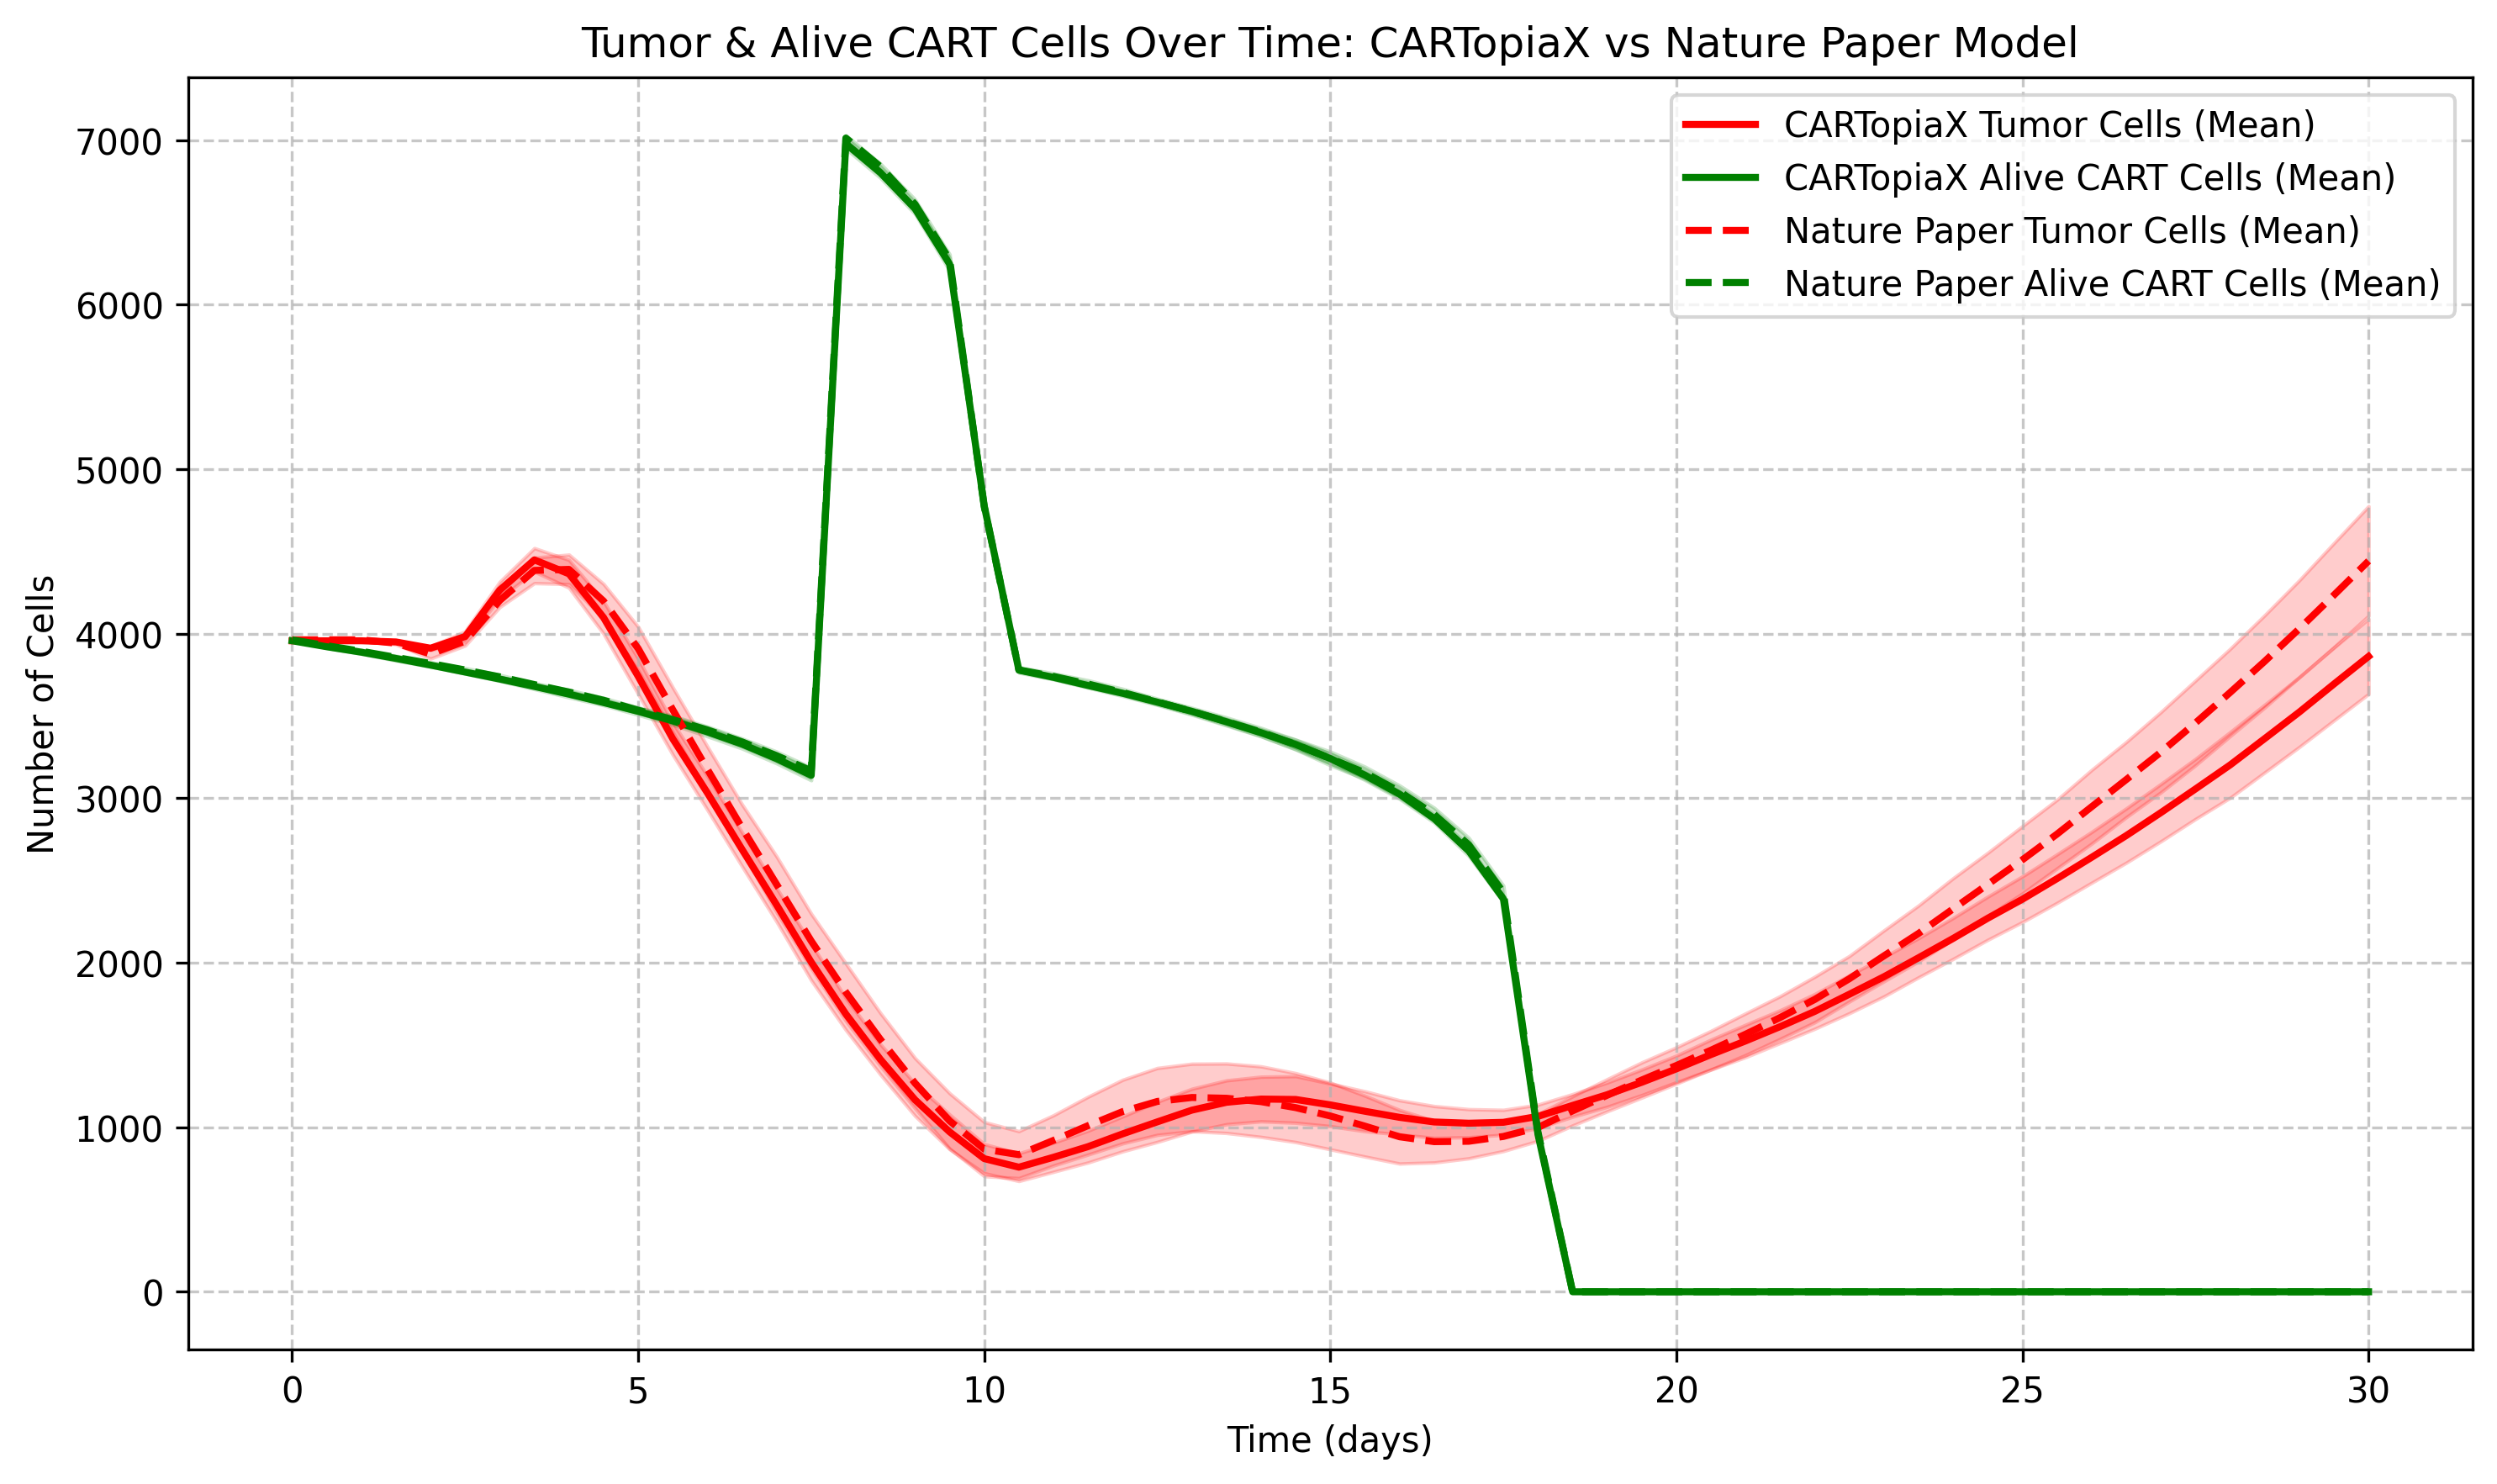
The following example models the same 150 µm-radius tumor, but with a single CAR T-cell dose, equal in number to the tumor cells administered, on day 0. The CAR T-cell population then declines stochastically due to apoptosis, reaching minimal levels around day 10. The plot below shows the total tumor and CAR T-cell populations over time:
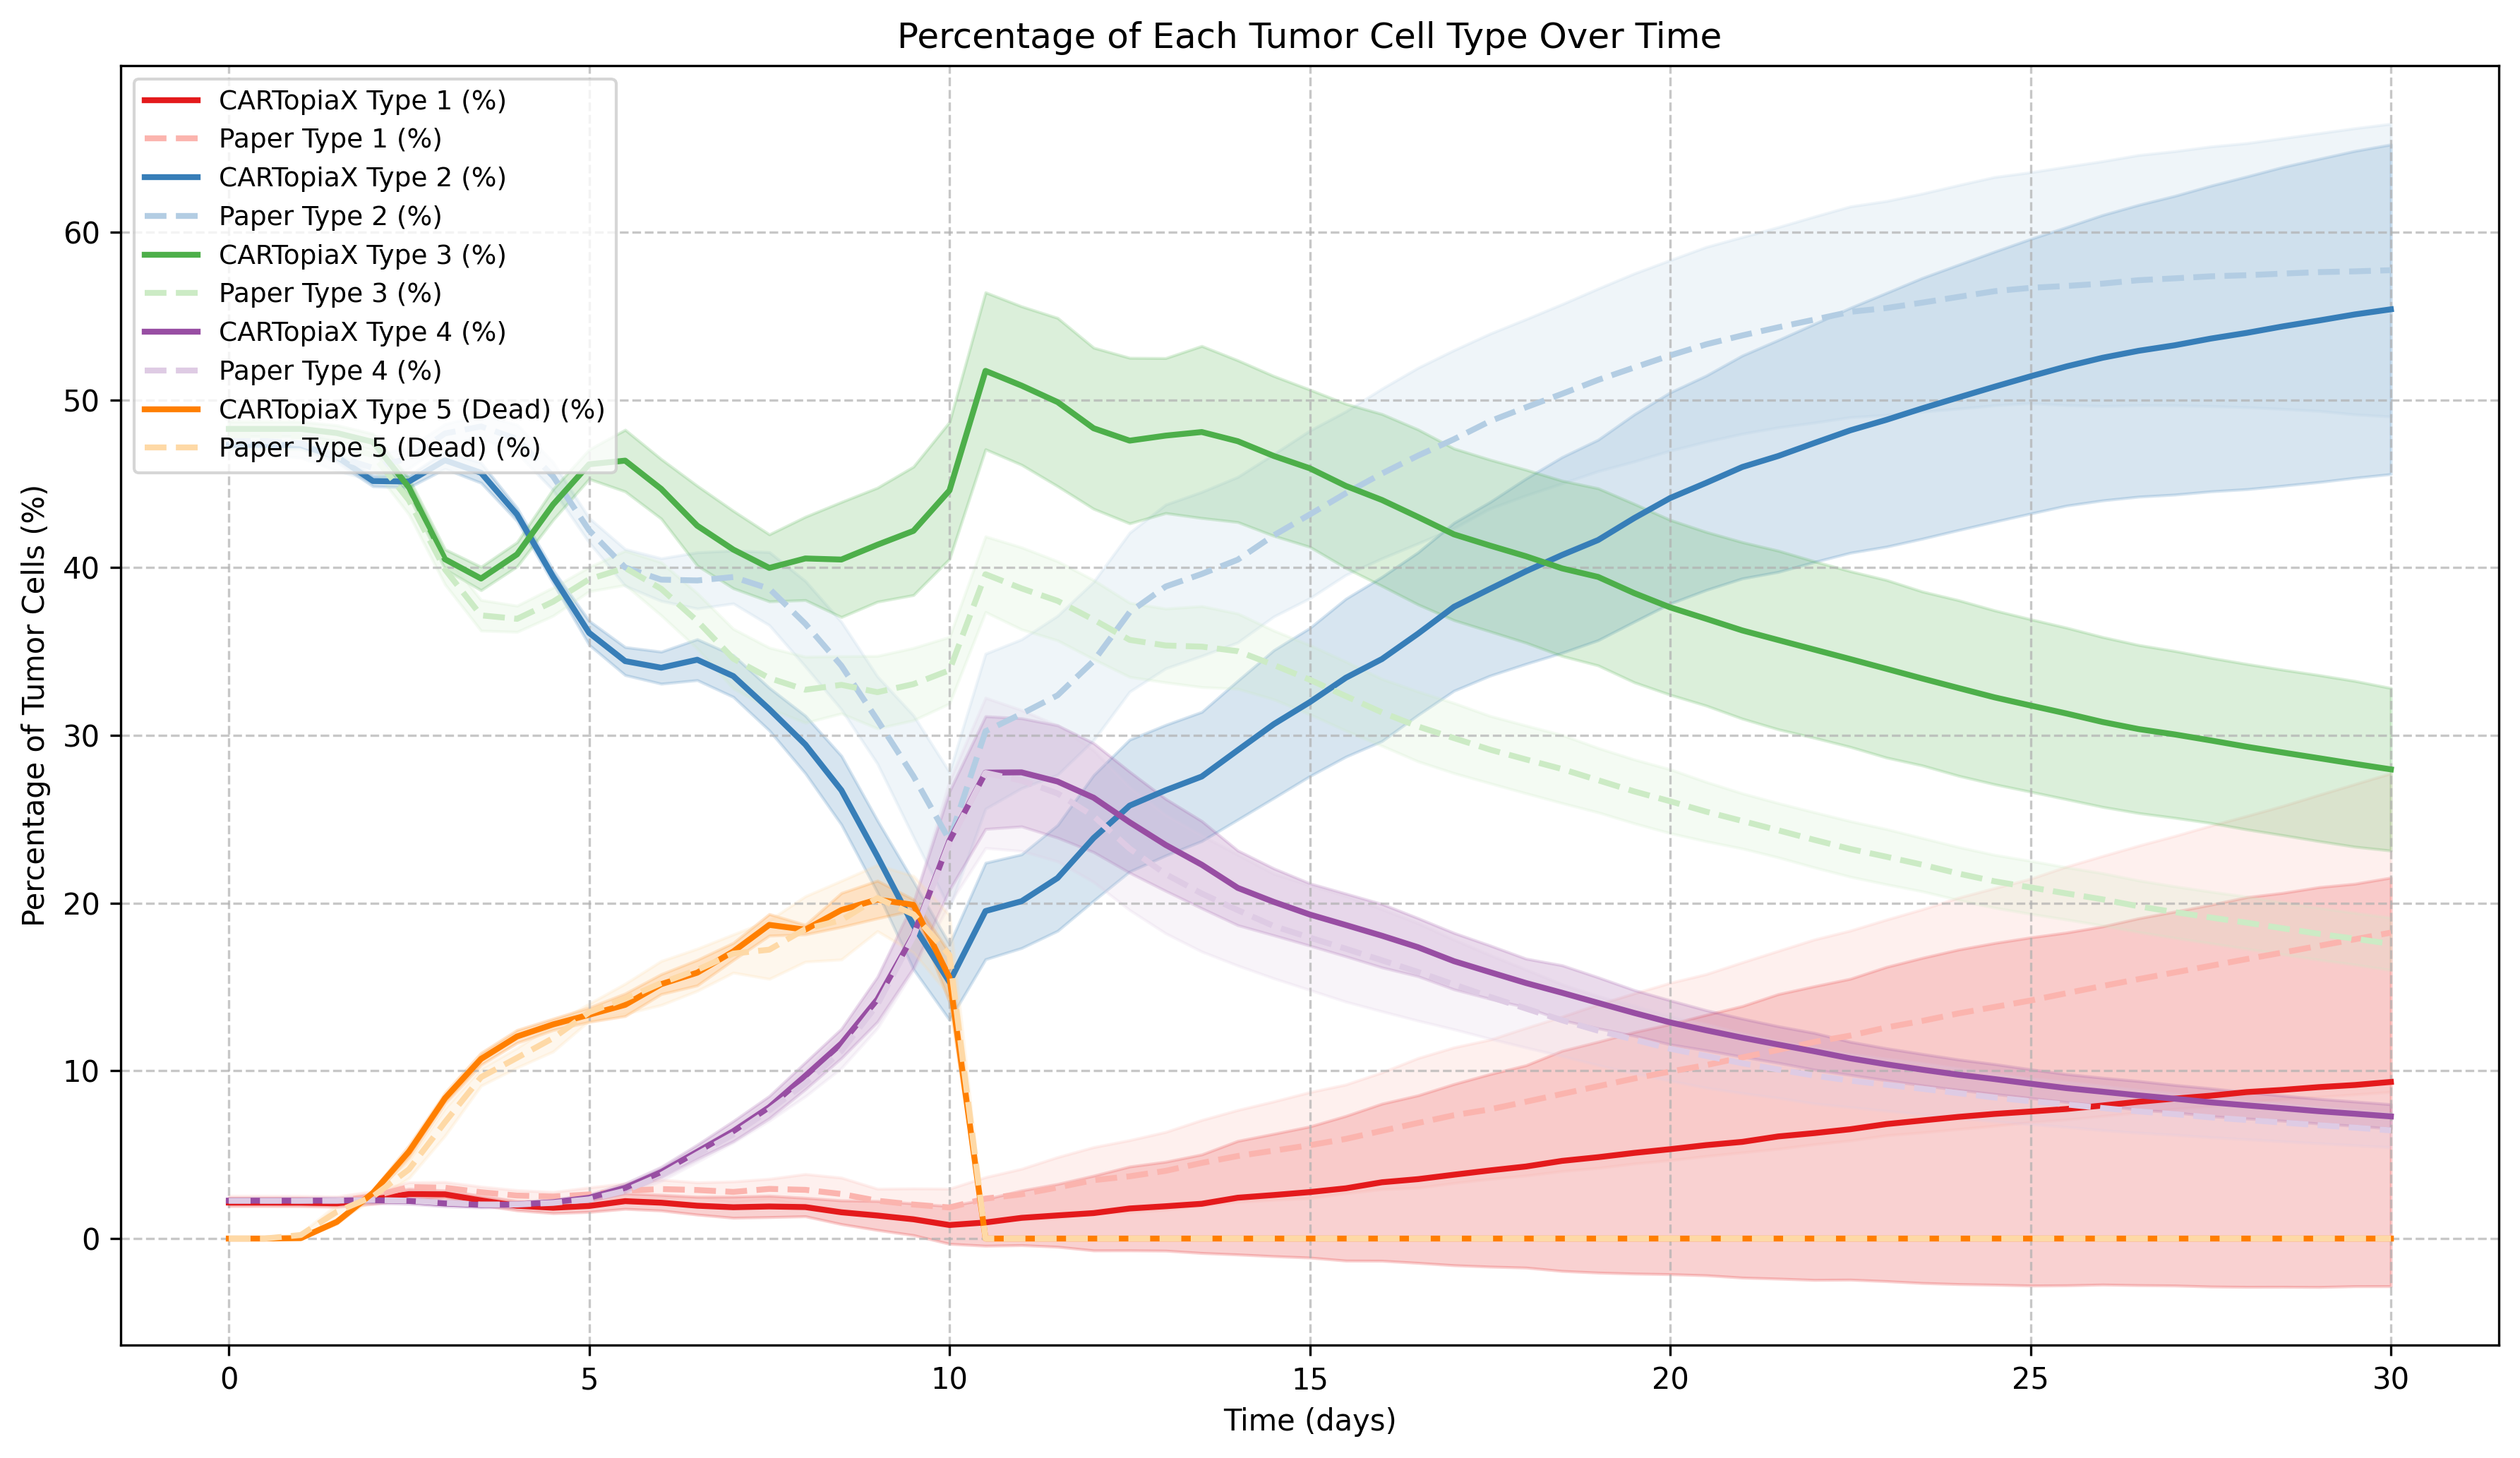
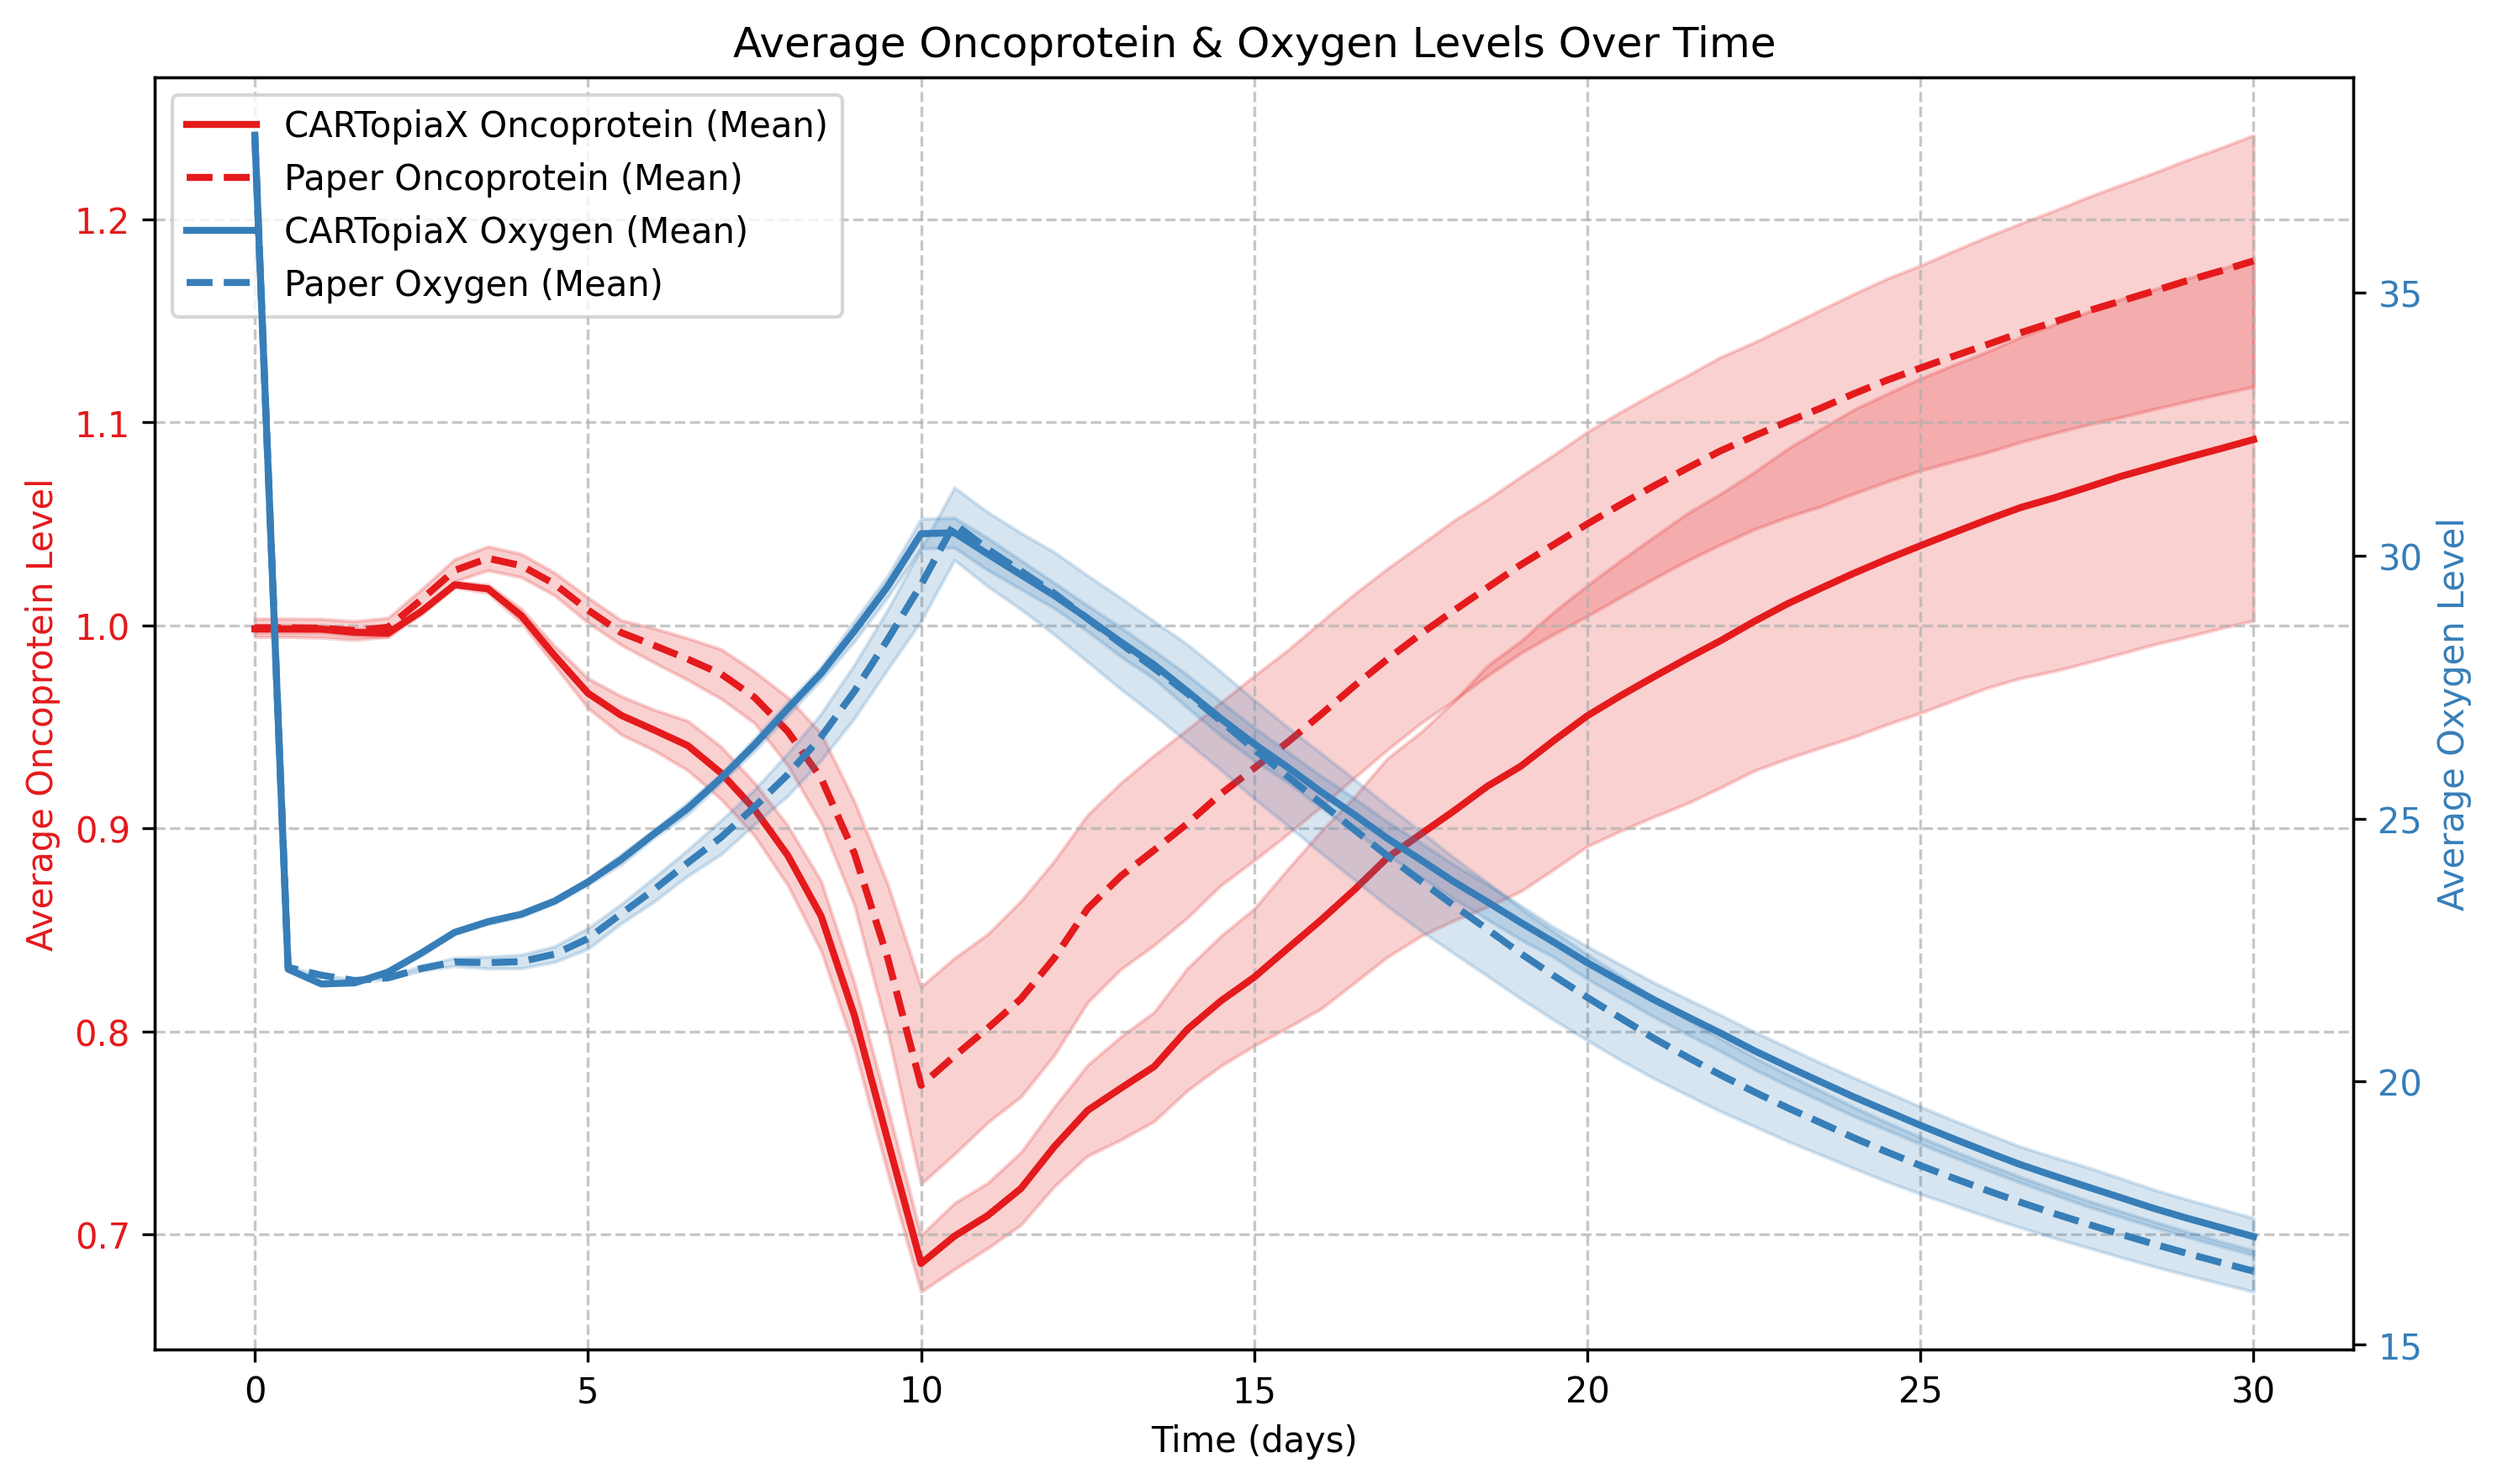
All cells consume oxygen, and cancer cells can die from necrosis in its absence. In addition, CAR T-cells tend to eliminate higher oncoprotein-expressing cells more effectively, leading to the following dynamics:
Before day 10: CAR T-cells are actively killing tumor cells and Type 1 and 2 cell populations decrease as more proliferative cancer cells are targeted.
After day 10: When CAR T-cells die from apoptosis, Type 1 and 2 cells increase their proportion in the tumor at the expense of Type 3 and 4 cells, as high-oncoprotein-expressing cells divide faster.
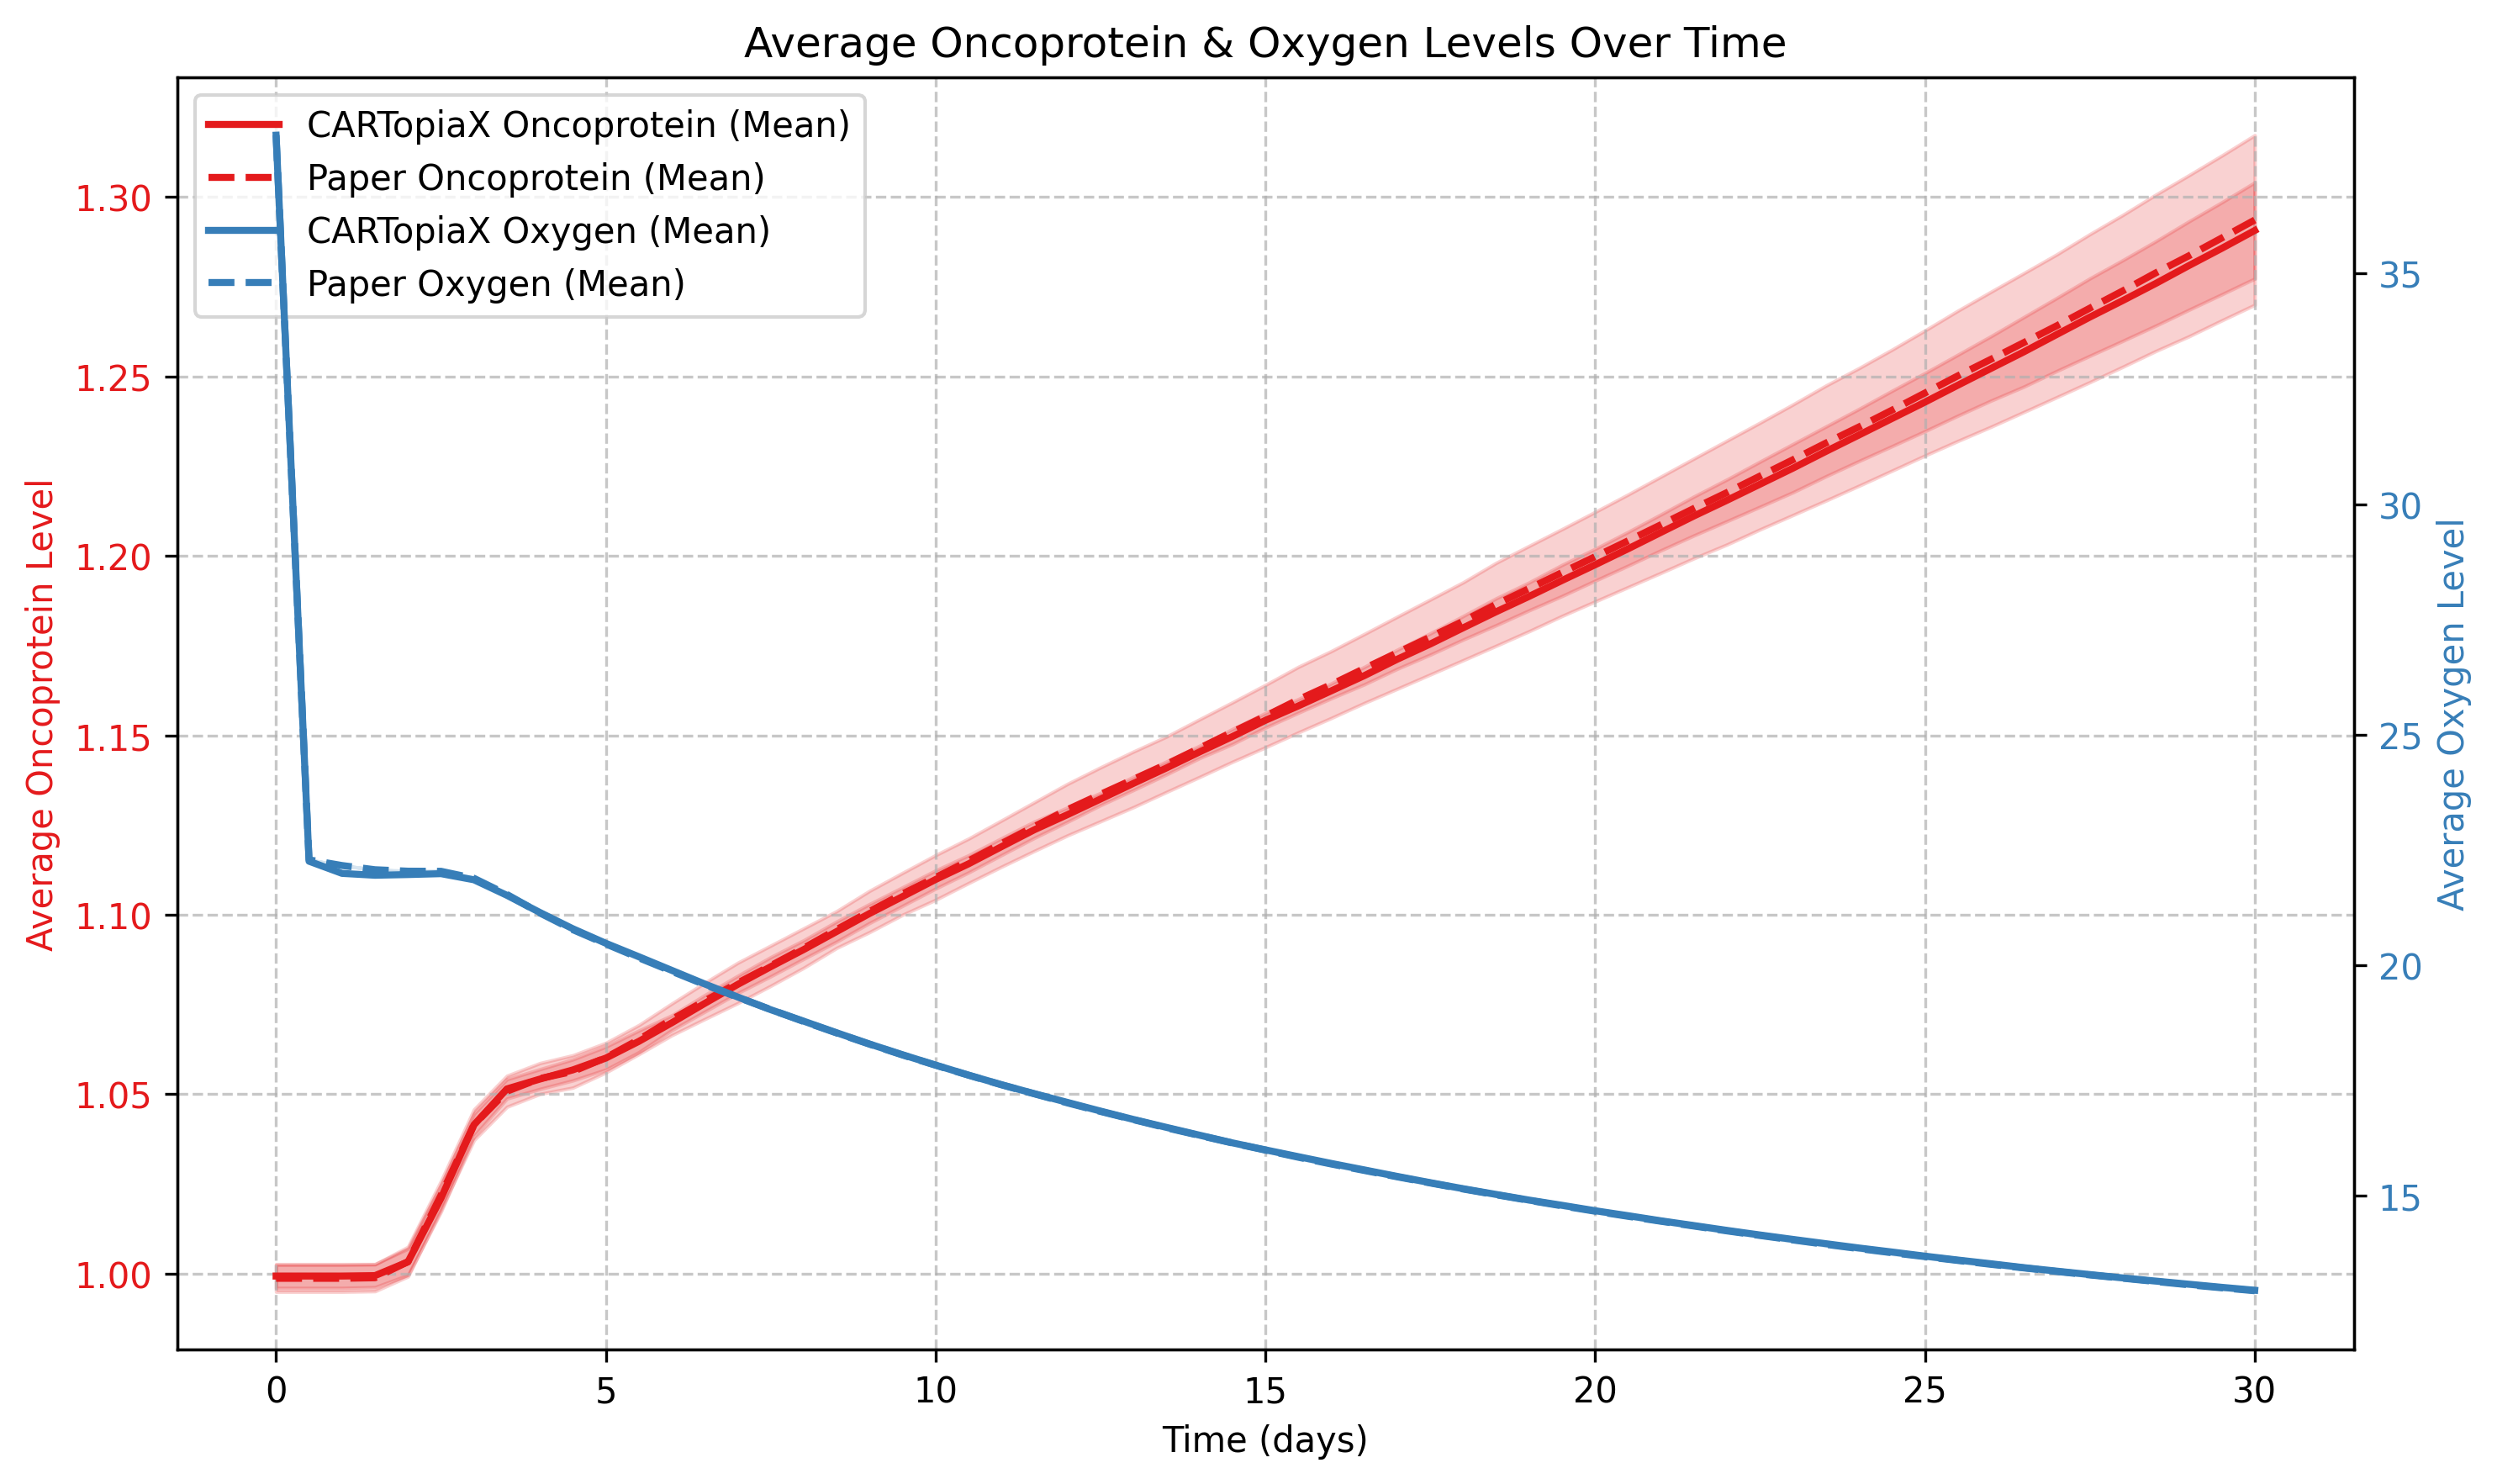
Before day 10: In the beginning, oxygen levels decrease with CAR T-cell arrival. Then they gradually rise as both CAR T-cells and tumor cells die, reducing overall consumption. On the other hand, the average oncoprotein level drops rapidly due to CAR T-cell preferential elimination of the most aggressive cancer cells.
After day 10: CAR T-cells are no longer present and therefore tumor resumes growth, making oxygen levels decline. In addition, oncoprotein levels rise as highly proliferative cells dominate once again.
During the simulation, dead and resistant cells accumulate around the tumor core, forming a shield-like barrier that impedes CAR T-cell infiltration and reduces treatment effectiveness.
A 3D visualization of the sliced tumor and CAR T-cell treatment used in this example, rendered in ParaView, is available here:
Watch the simulation video
Replication Example: Less is better, increasing cellular dosage does not always increase efficacy
We consider again the 150 µm-radius tumor and now two CAR T-cell doses of scale 1:1 (equal in number to the initial tumor cells) are delivered on days 0 and 8. This way much less tumor cells are present at day 30 in comparison to applying just one dose:
Delivering more CAR T-cells has helped in controlling the tumor, however this is not always the case. The next plot shows the same initial tumor but with two CAR T-cell doses containing a quantity twice the initial tumor cell count, on days 0 and 5. By day 30, the number of tumor cells is roughly the same as before, despite using twice the amount of CAR T-cells.
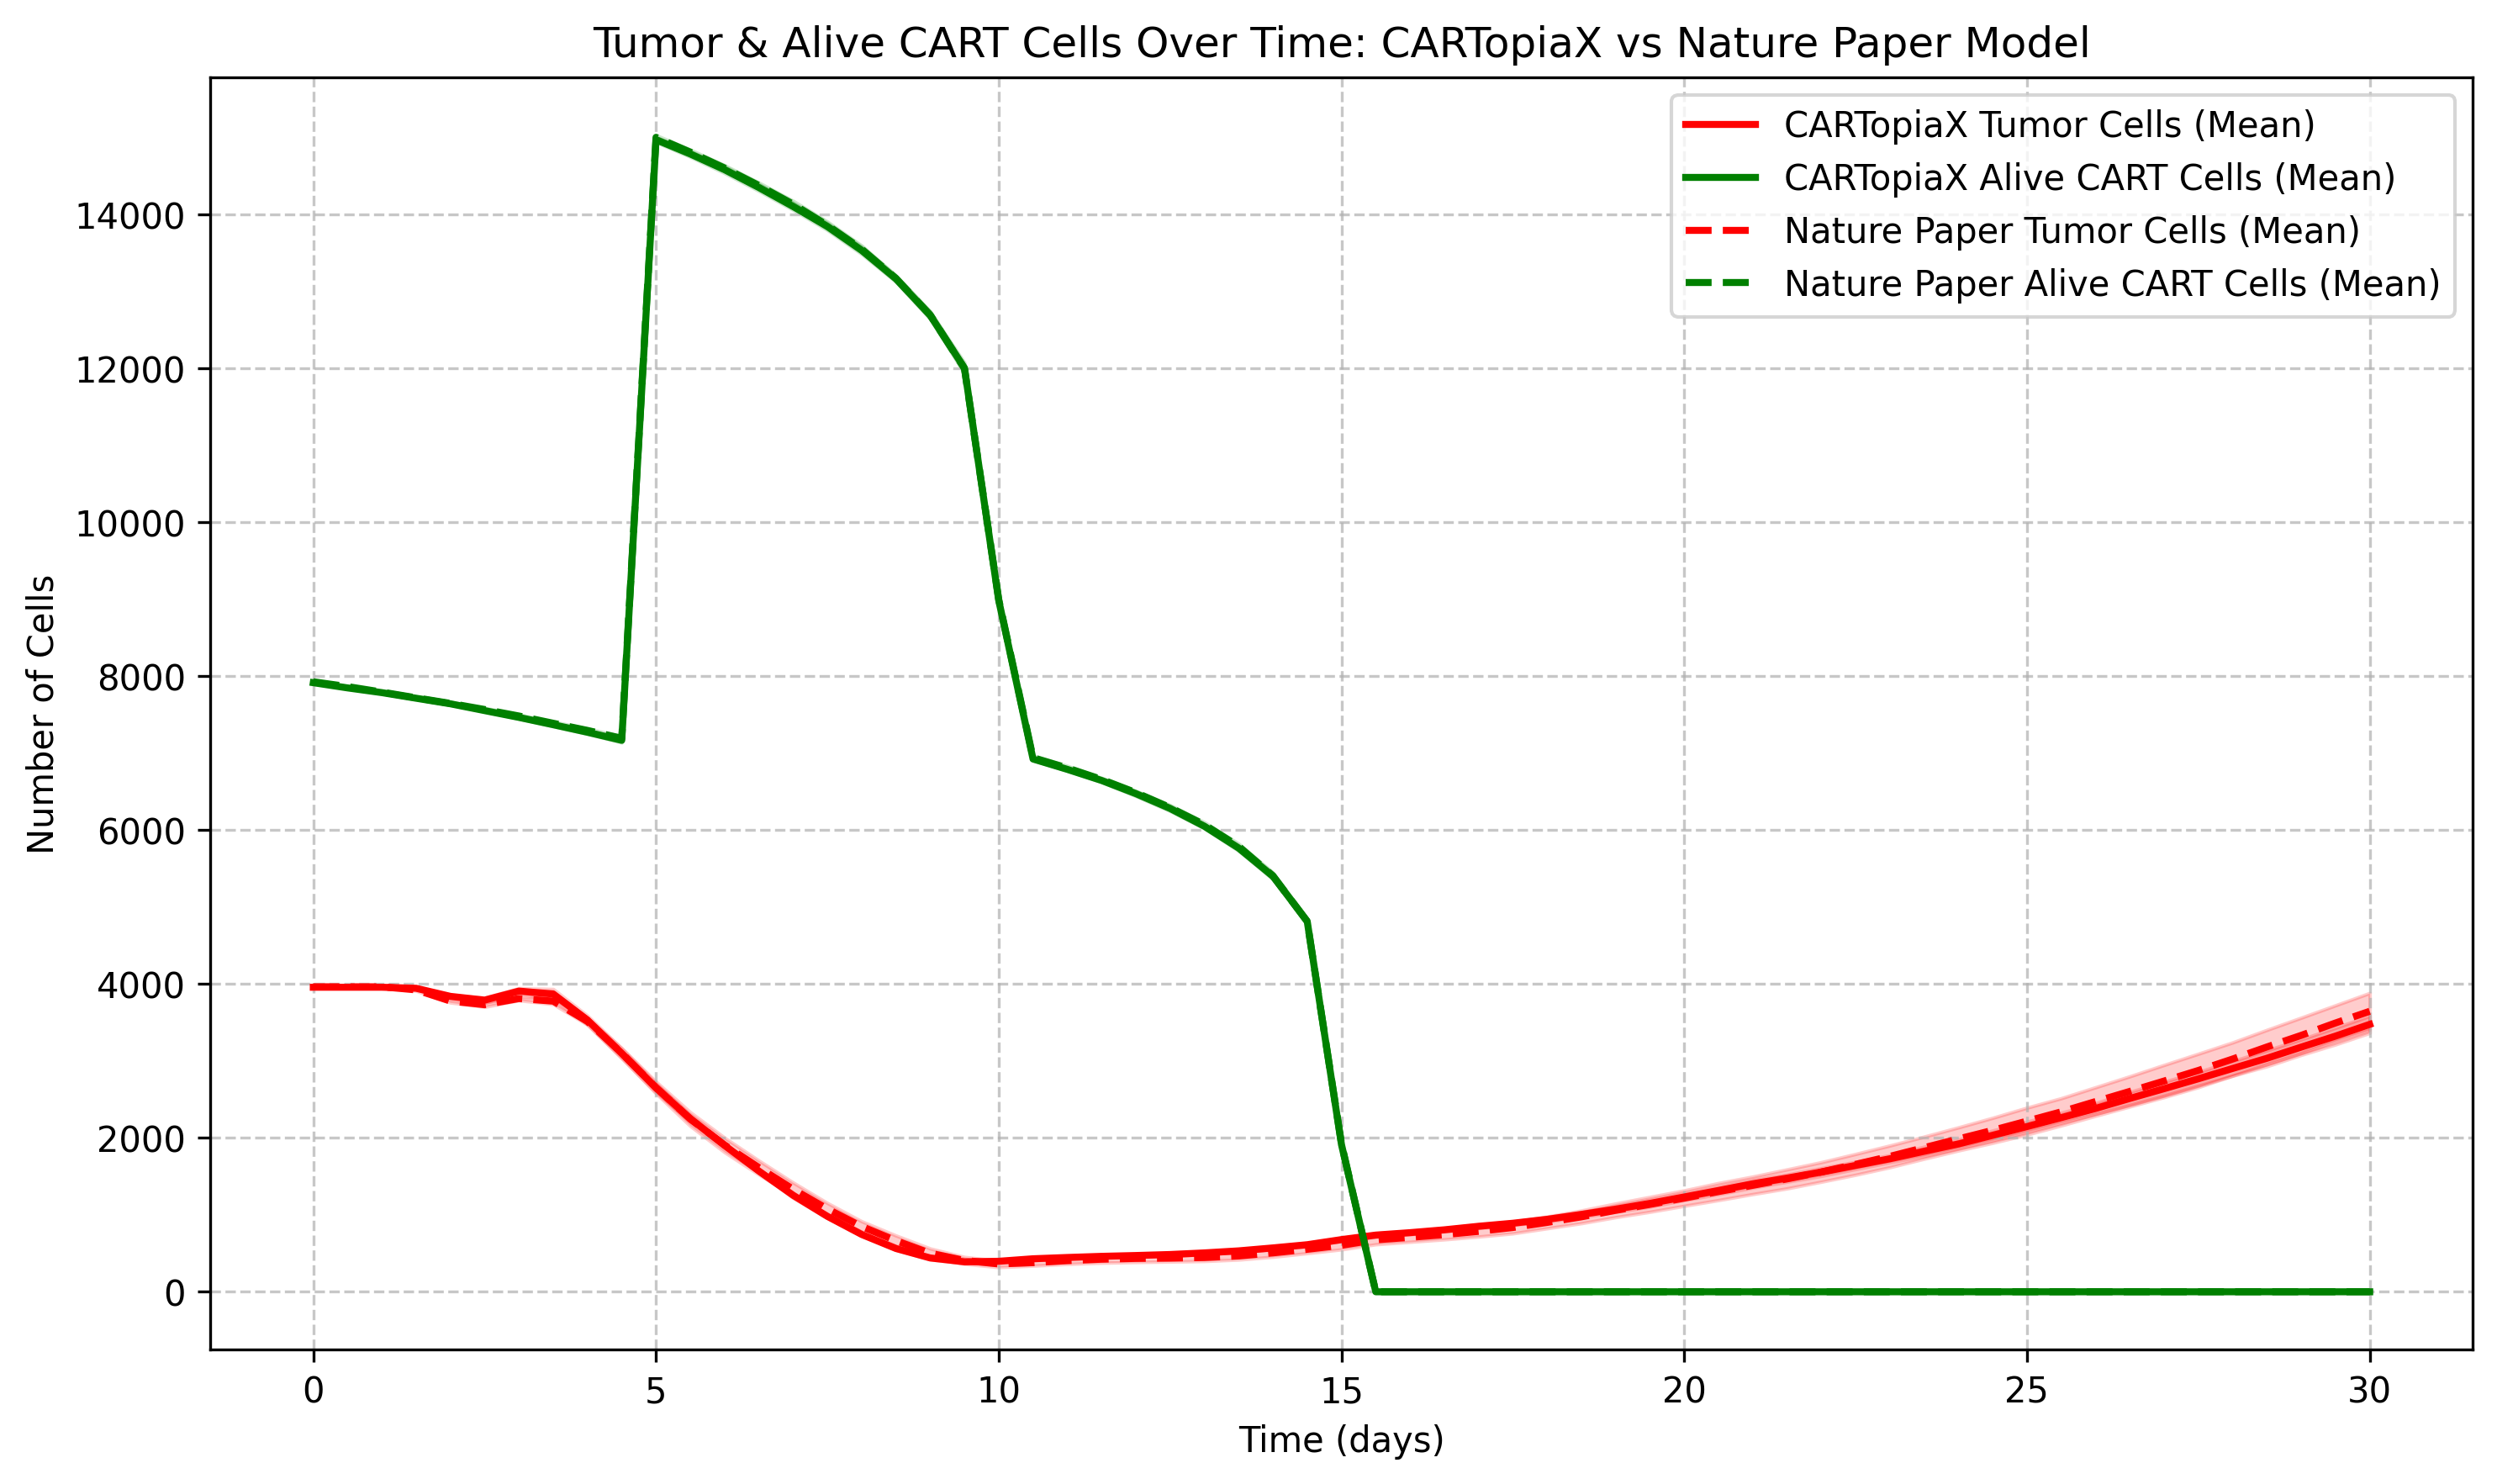
Increasing CAR T-cell dosage does not necessarily improve tumor killing and can increase toxicity. The model suggests two doses at a 1:1 CAR T-to-cancer cell ratio, balancing effectiveness and safety, minimizing inactive free CAR T-cells.
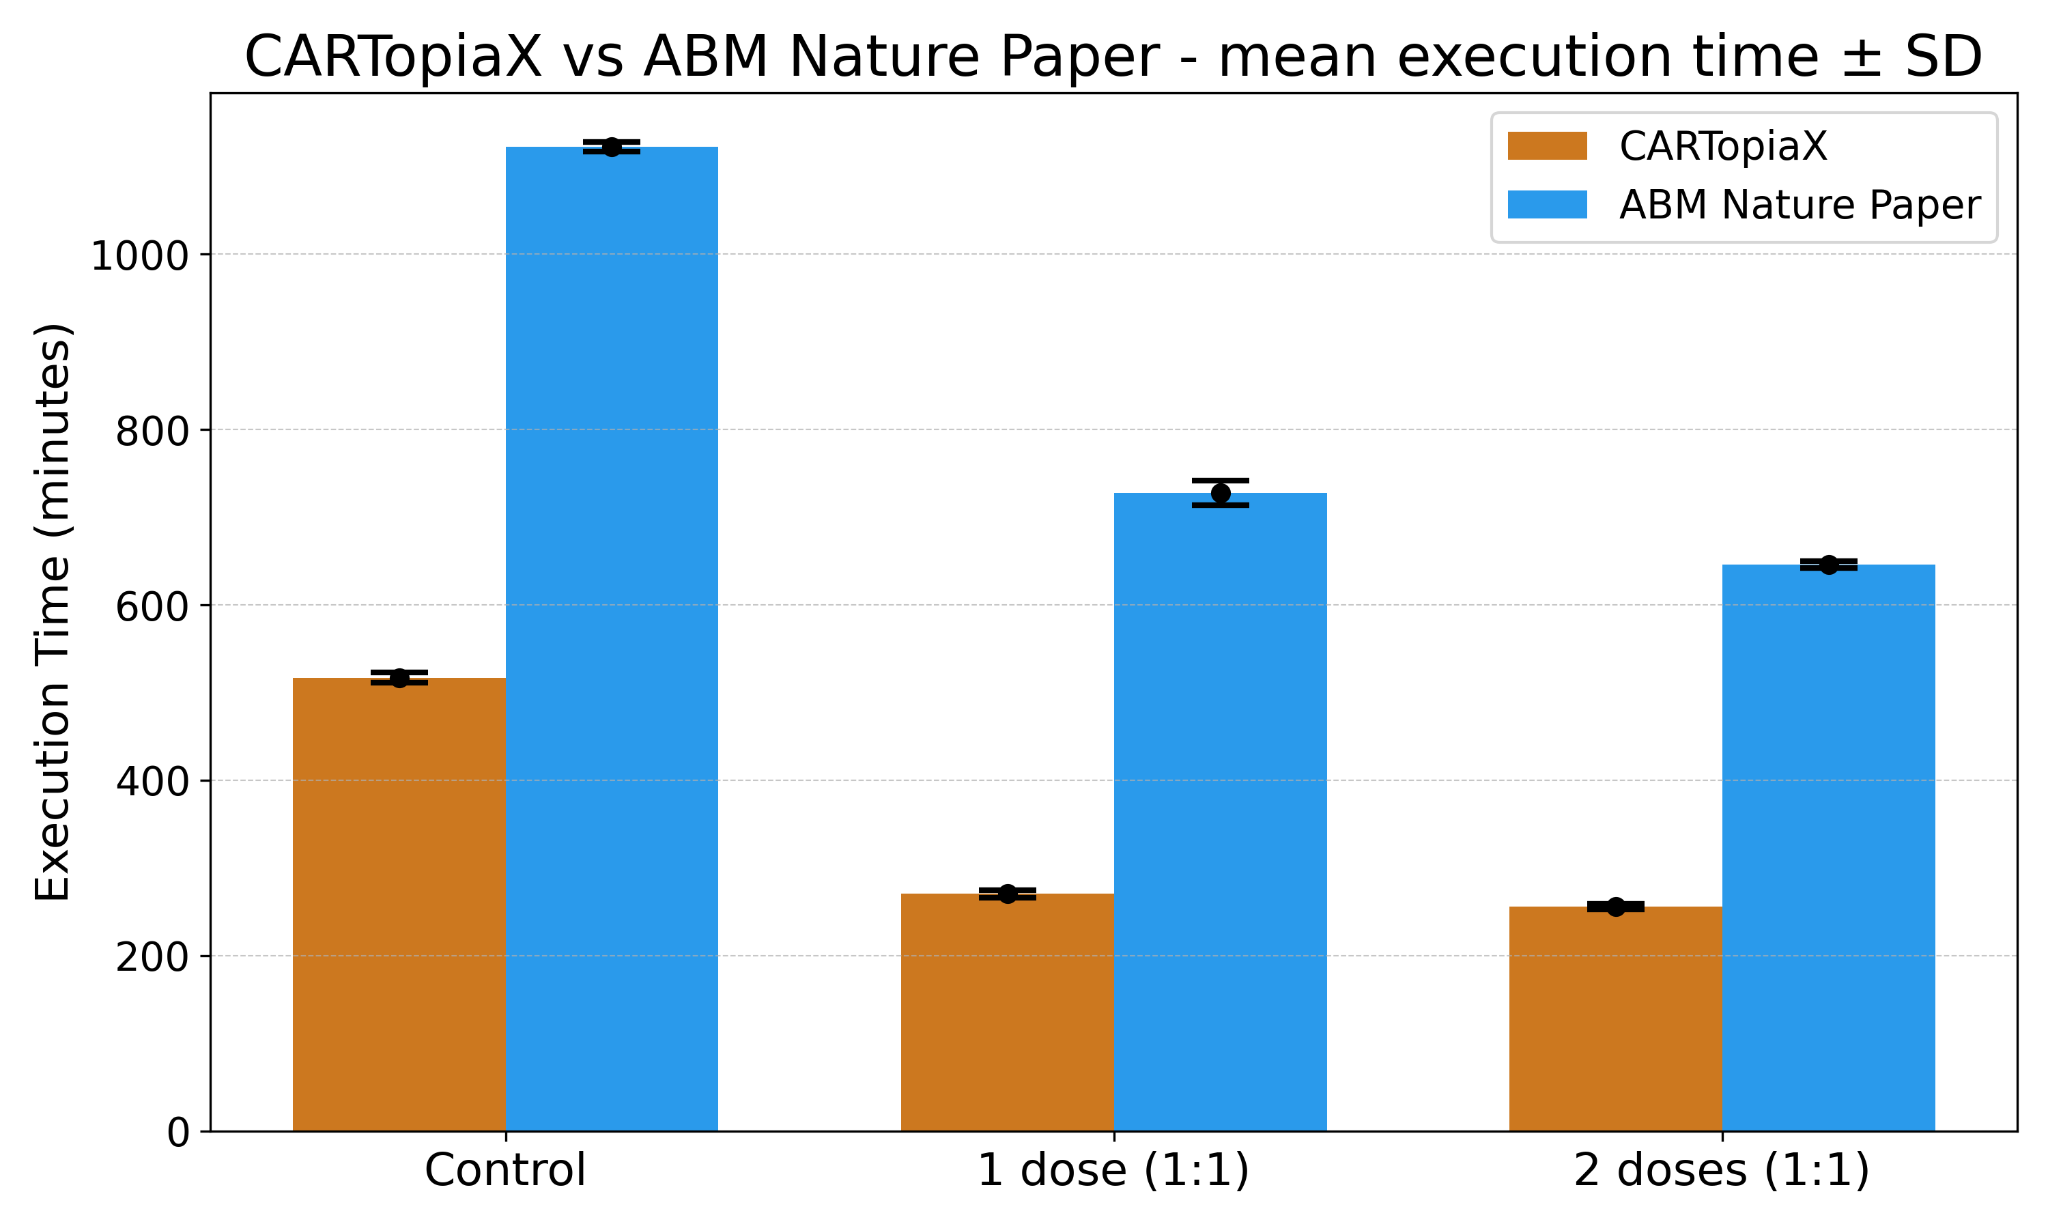
Performance
CARTopiaX successfully replicates the findings described in the Nature publication, achieving a 2× speed improvement compared to the previous implementation.
This performance gain enables faster scenario exploration and larger-scale simulations.
Conclusion
By building a BioDynaMo-based model of CAR T-cell therapy, we provide a flexible, high-performance tool for exploring treatment strategies in complex tumor environments. CARTopiaX combines speed, robust software quality, and a modular, open-source architecture, making it highly extensible and adaptable for future research. Altogether, it offers the scientific community an efficient framework that accelerates discovery, guides experimental design, and supports the development of more effective immunotherapies for solid tumors.
Related Links
- Project Repository
- BioDynaMo Repository
- Luque, L.M., Carlevaro, C.M., Rodriguez-Lomba, E. et al. In silico study of heterogeneous tumour-derived organoid response to CAR T-cell therapy. Sci Rep 14, 12307 (2024). DOI
- My GitHub Profile